T-Cell

Heatmap

heatmap

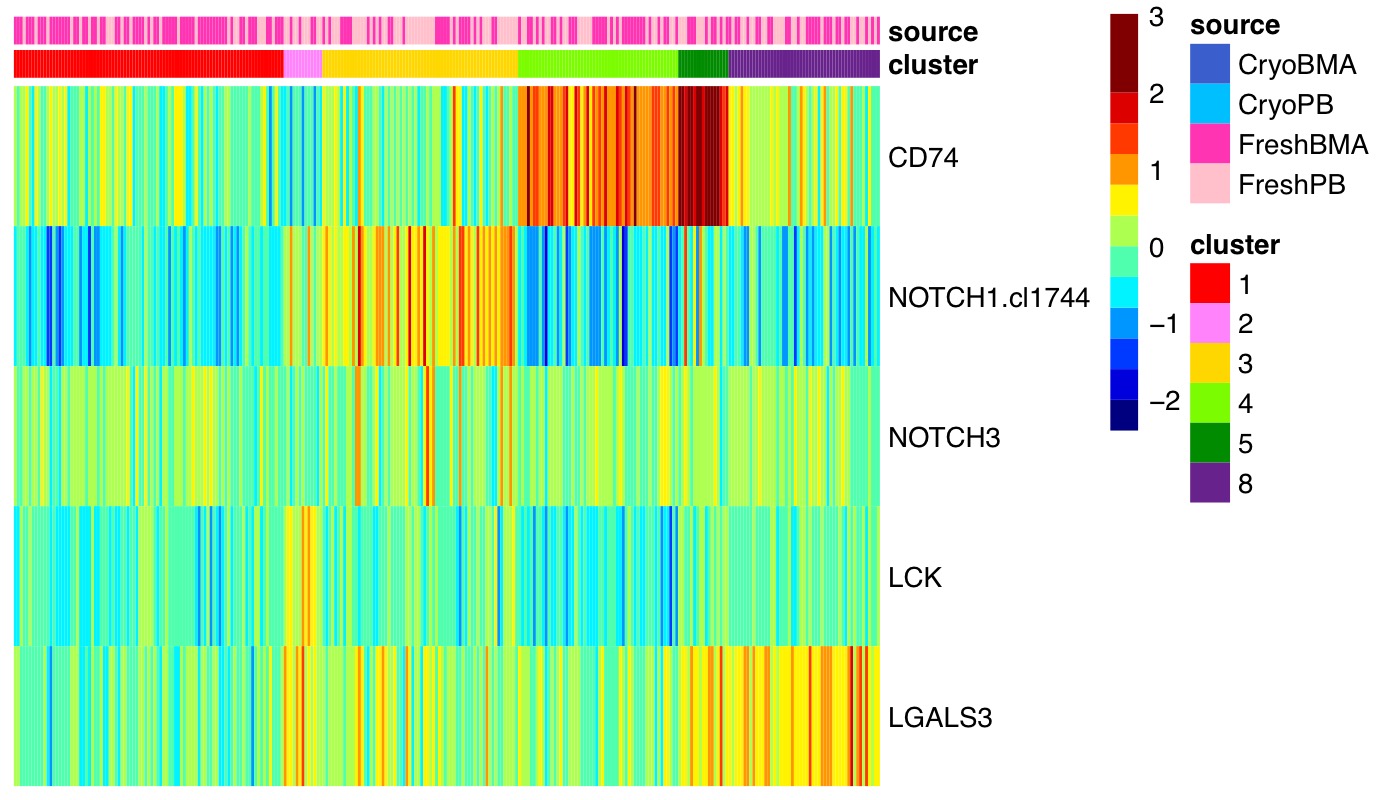
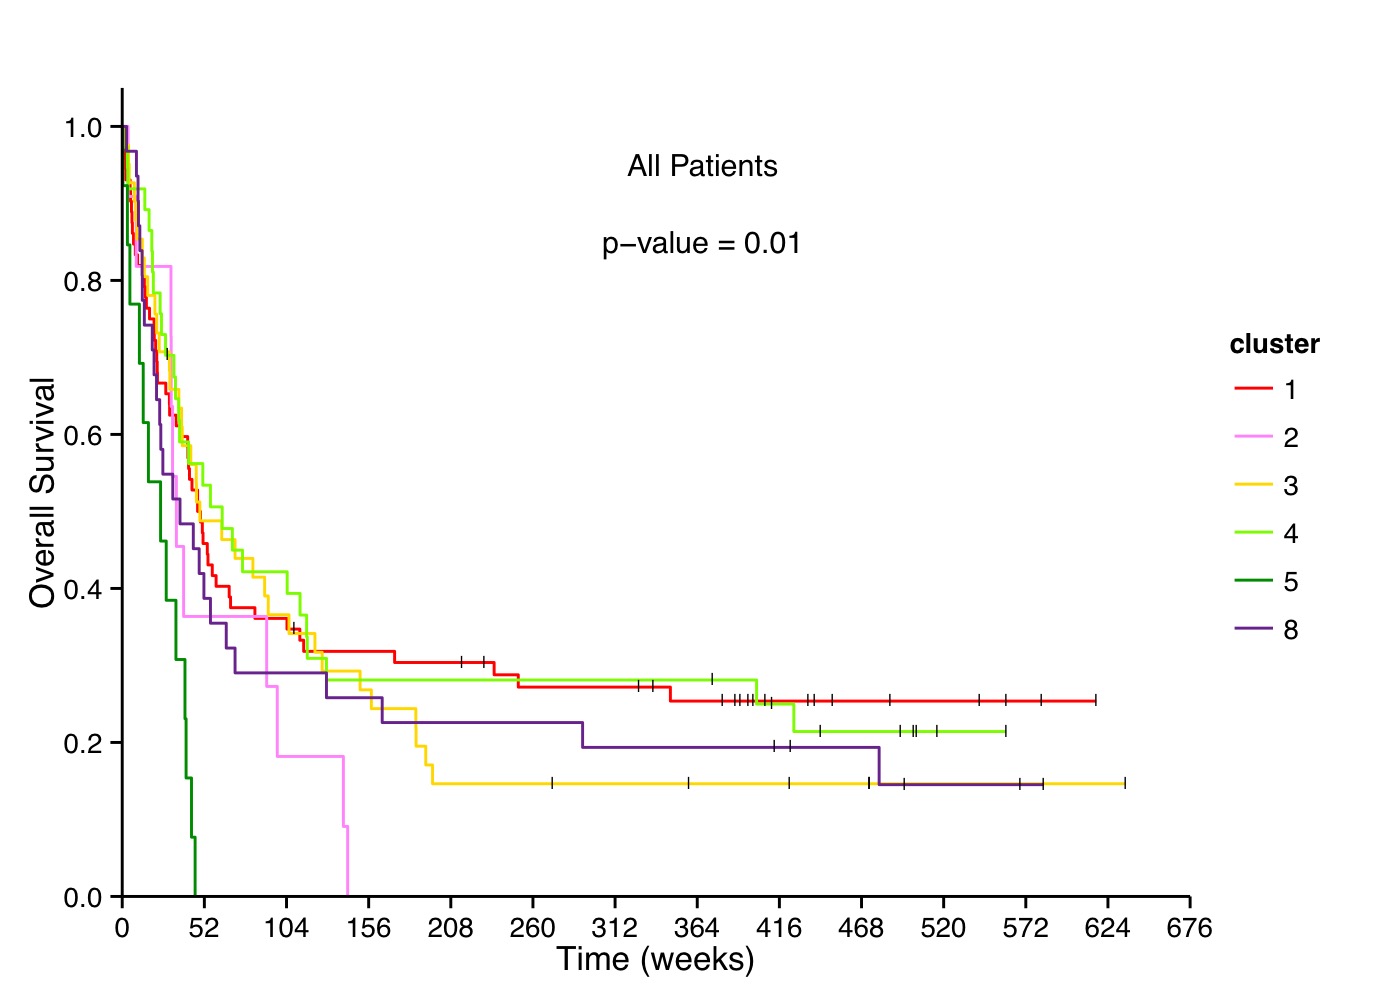
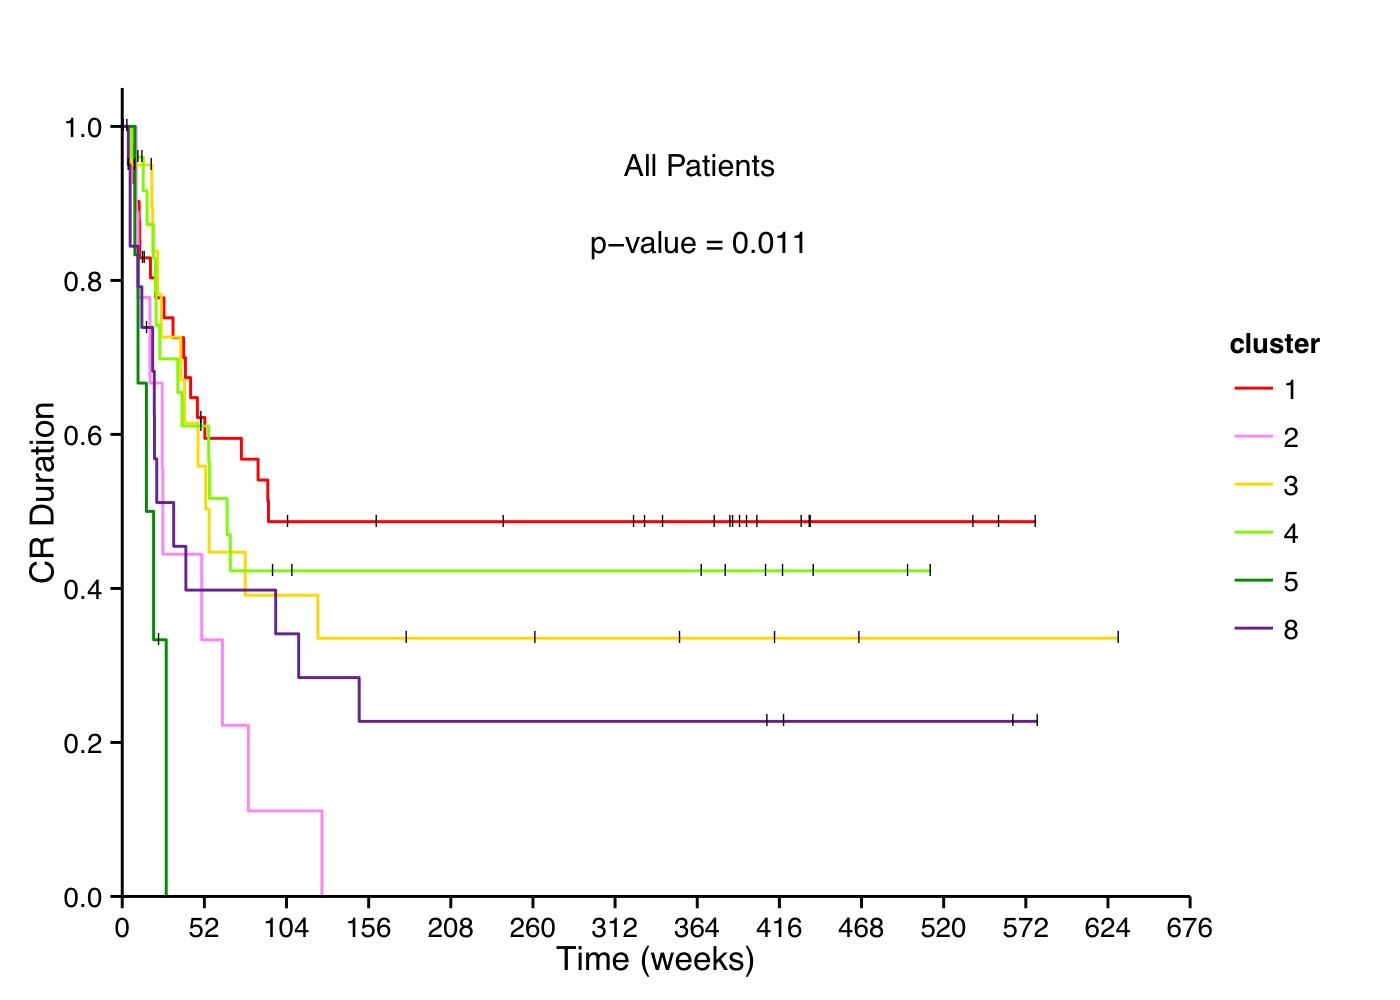
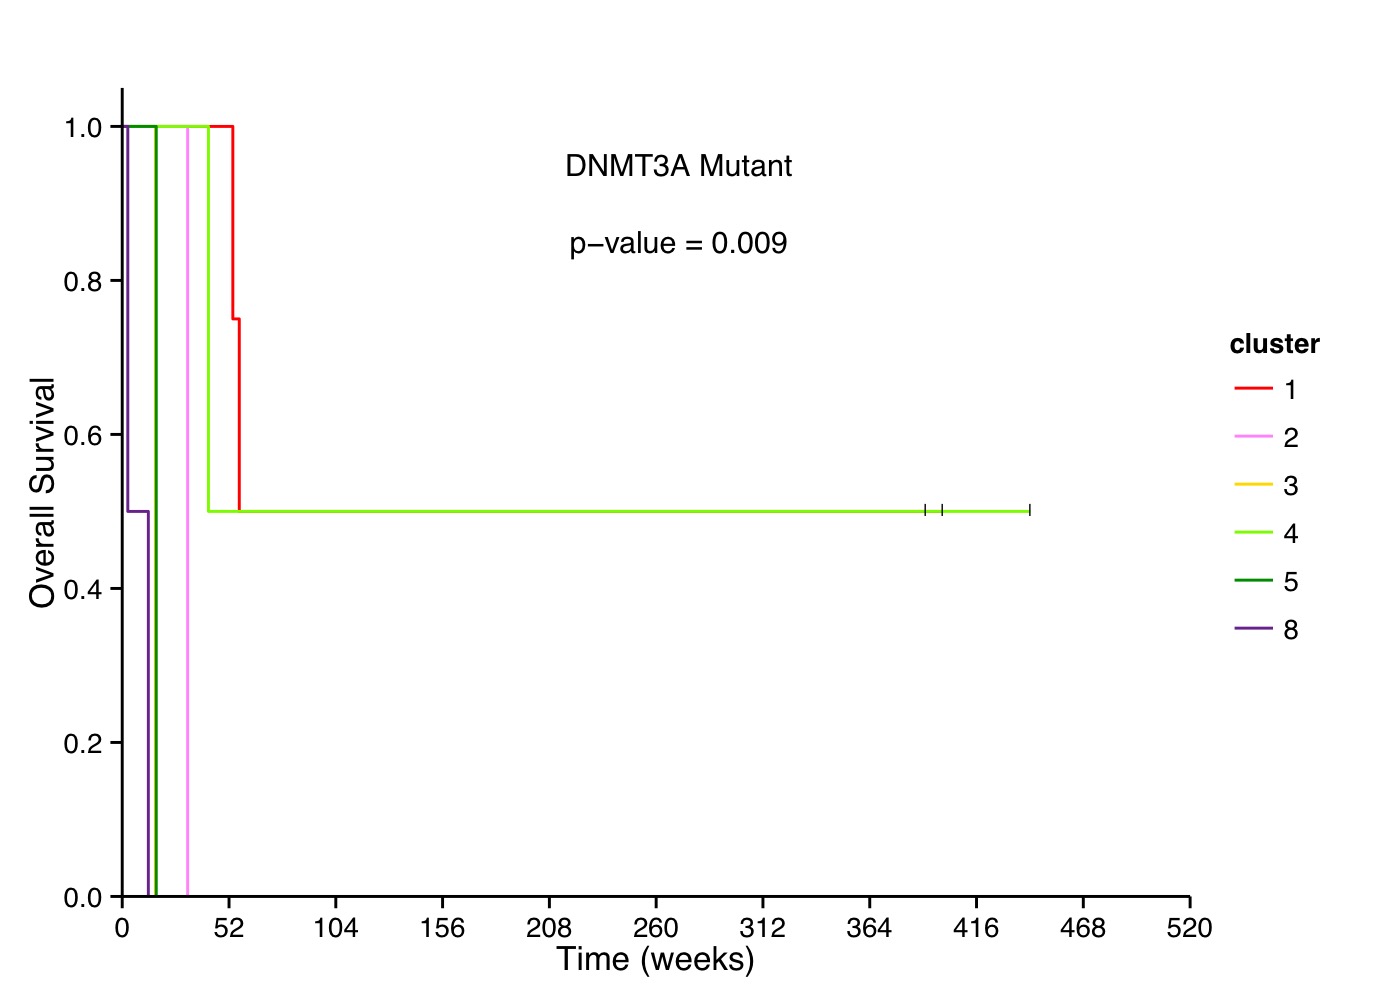
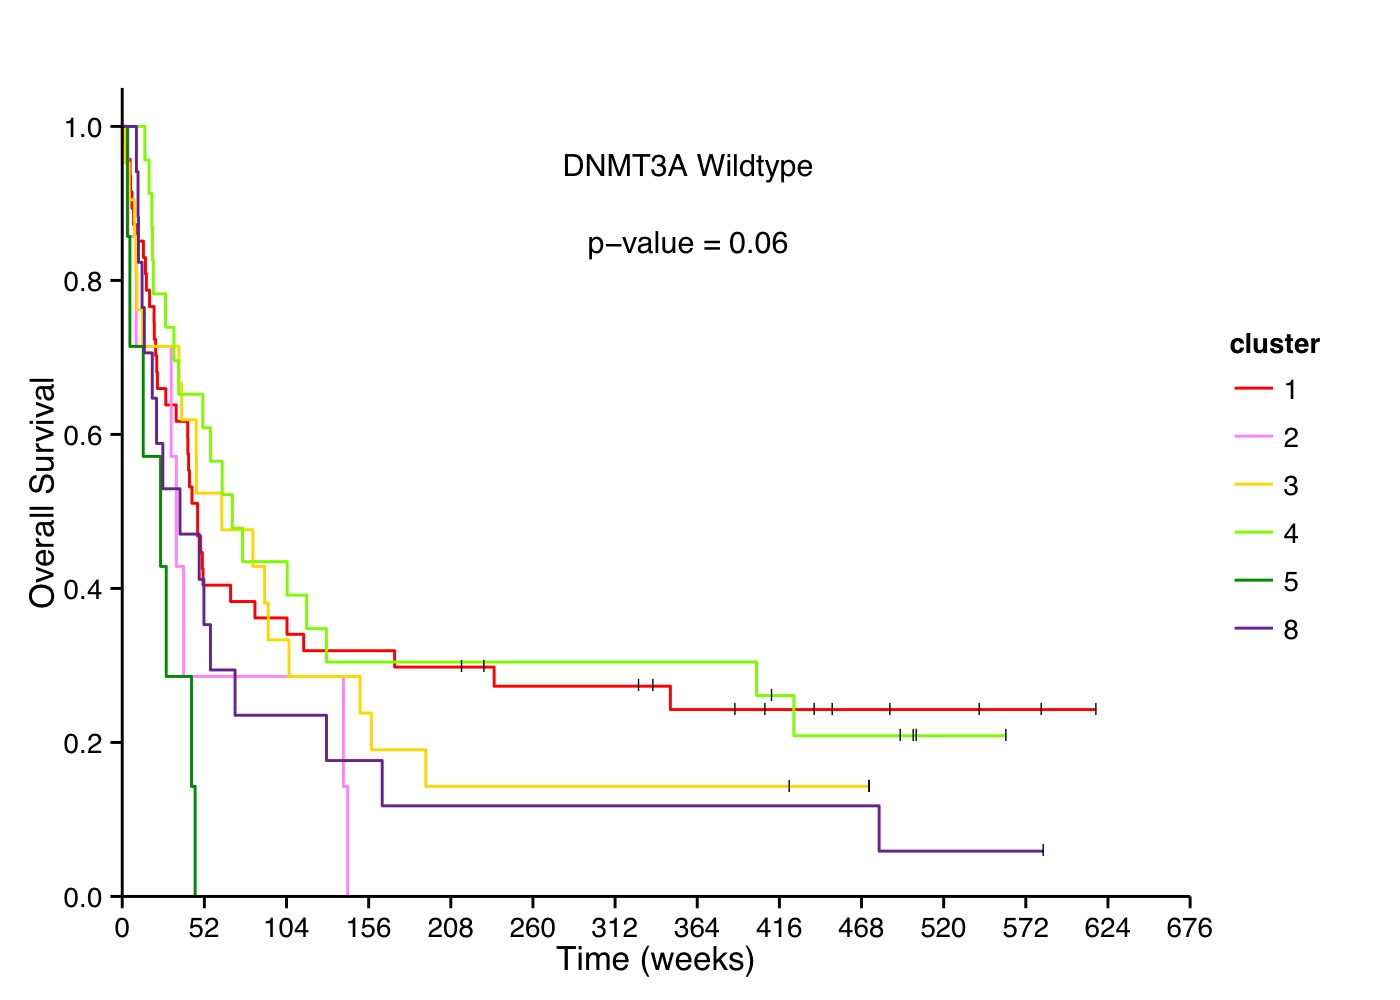
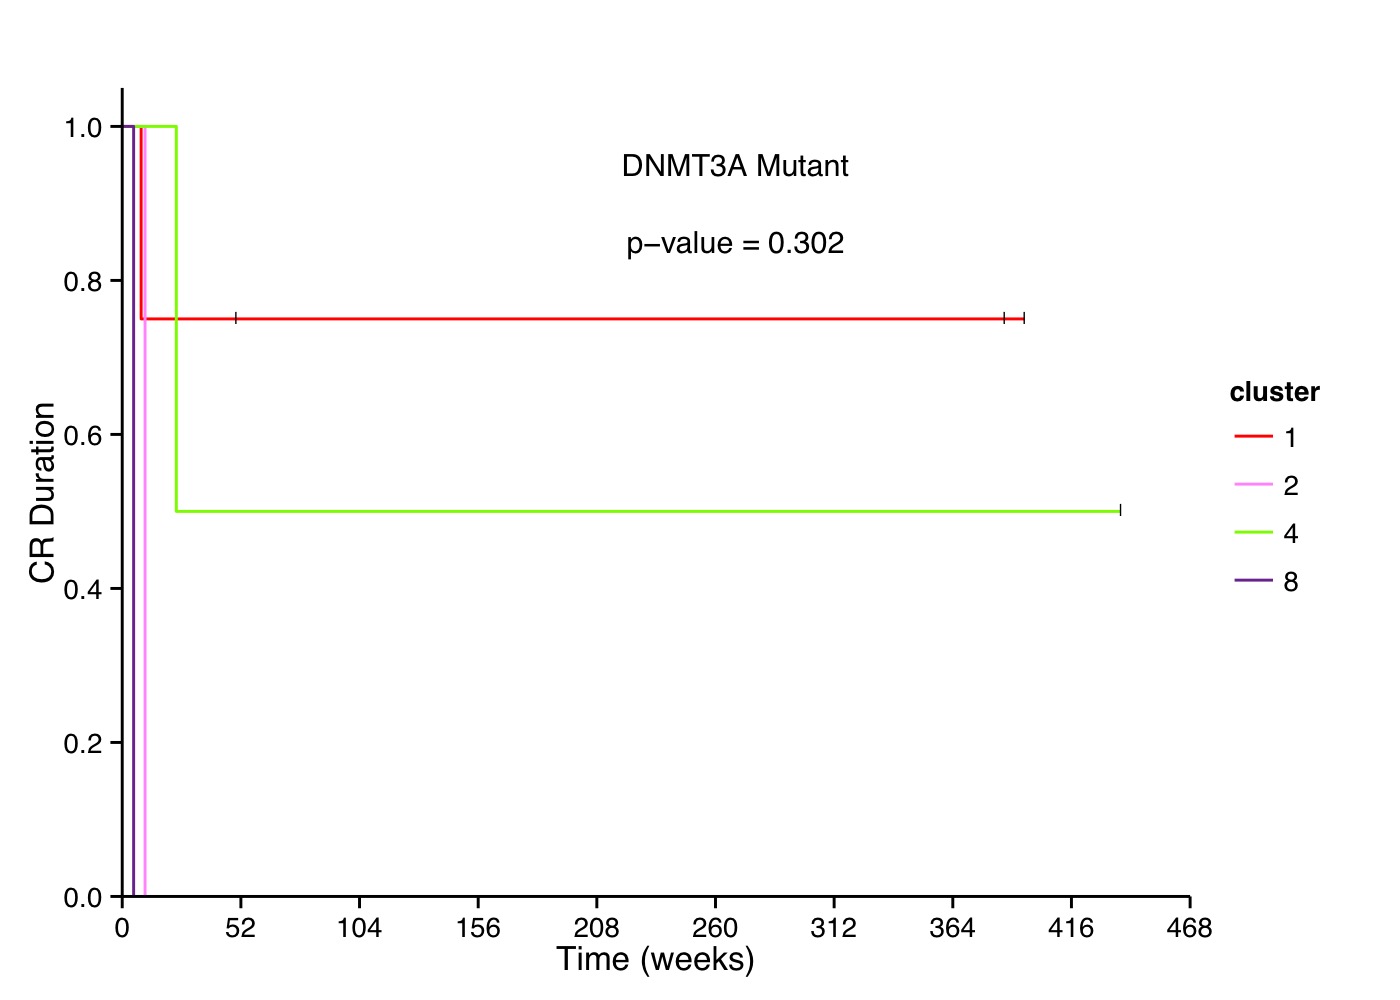
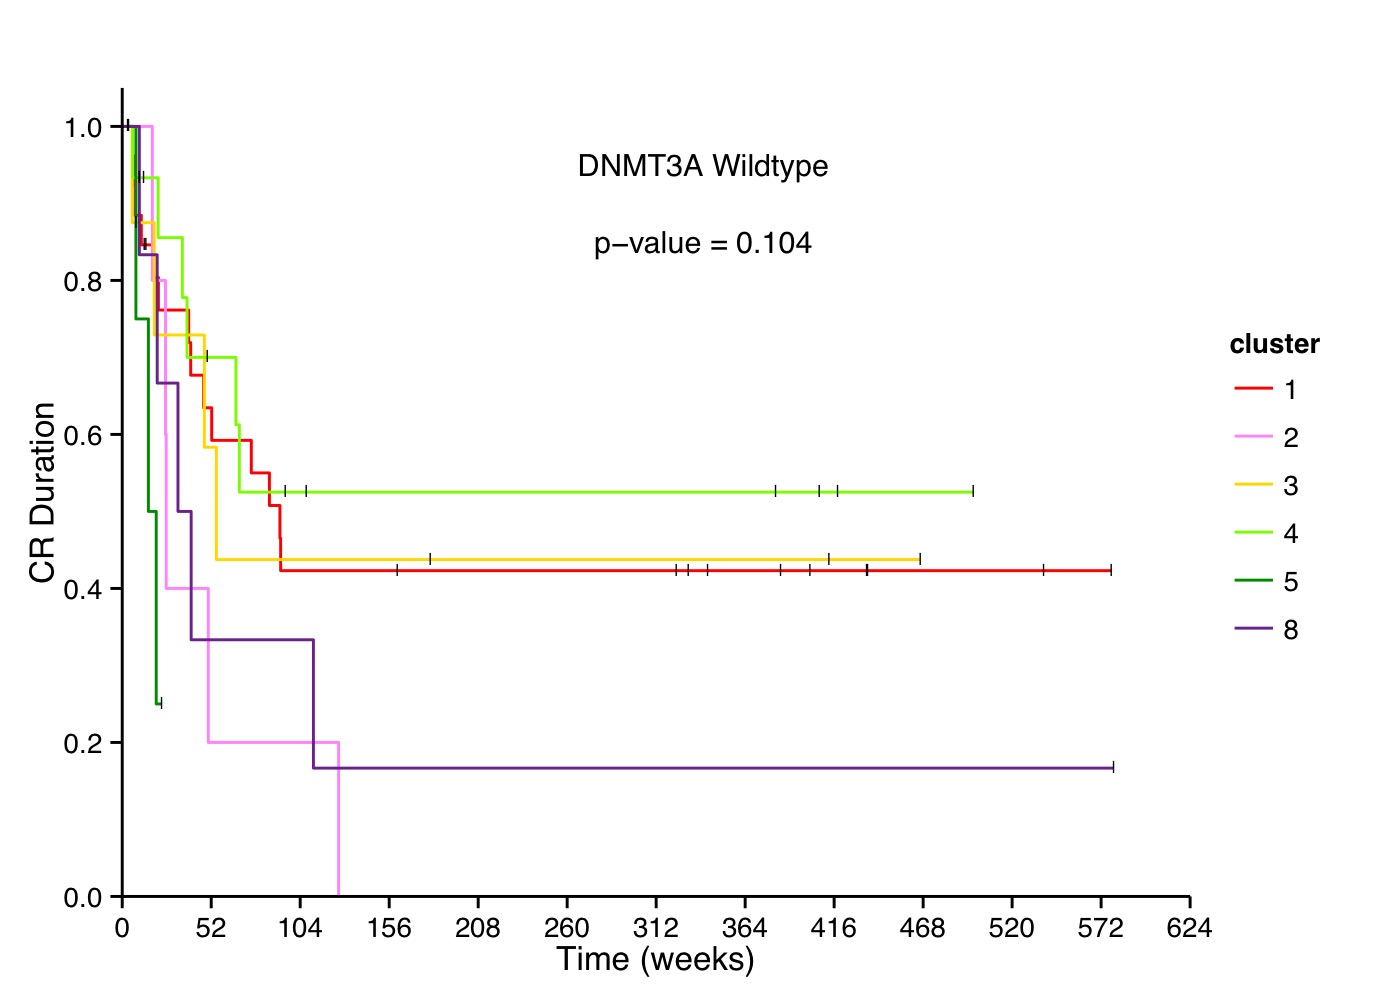
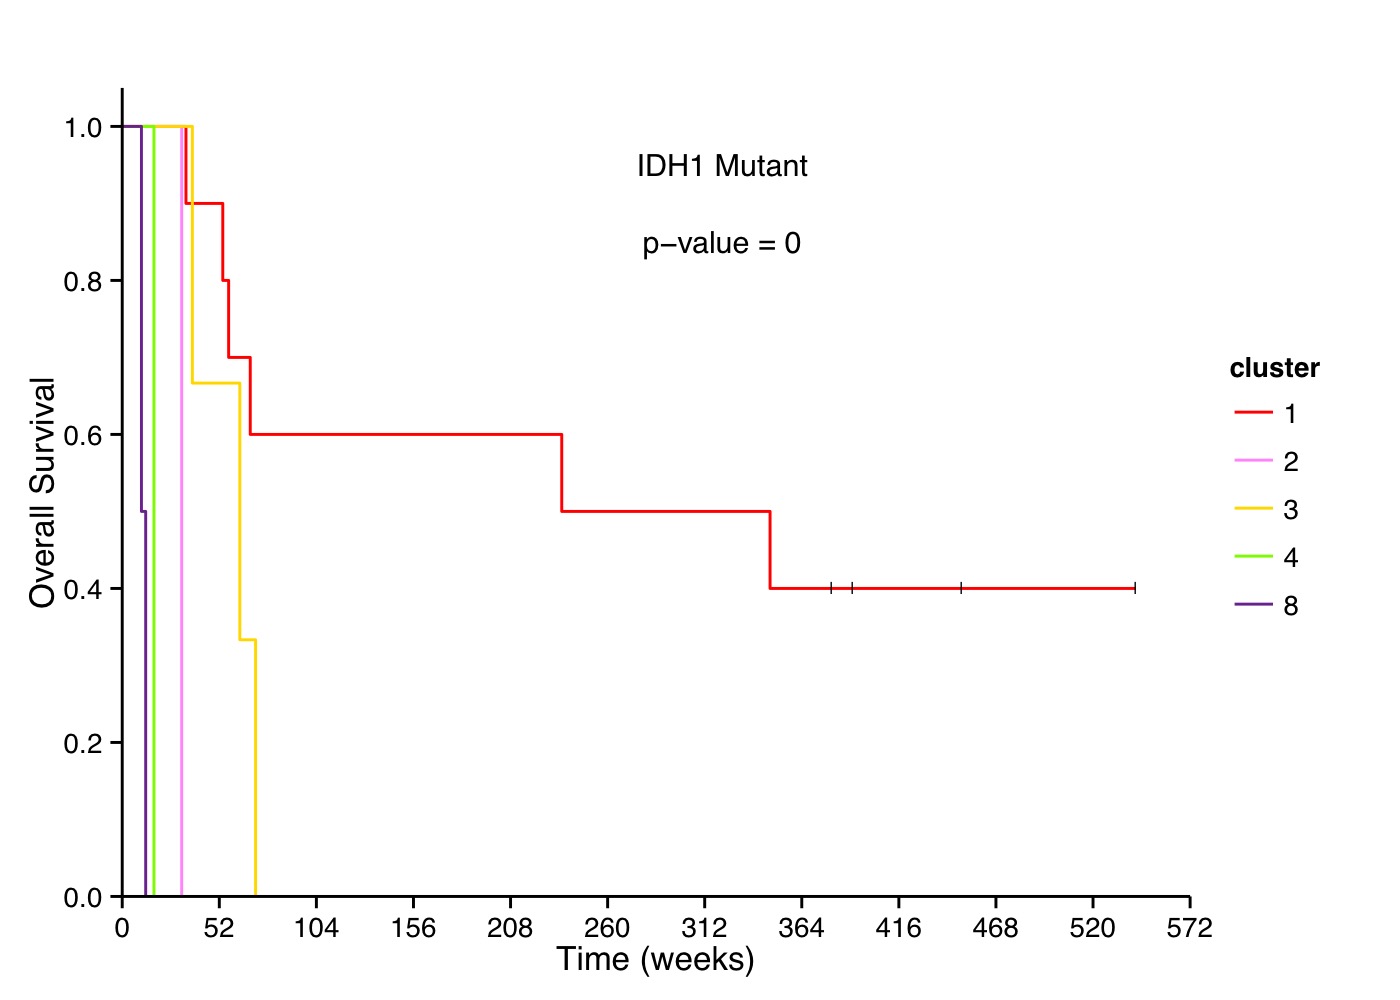
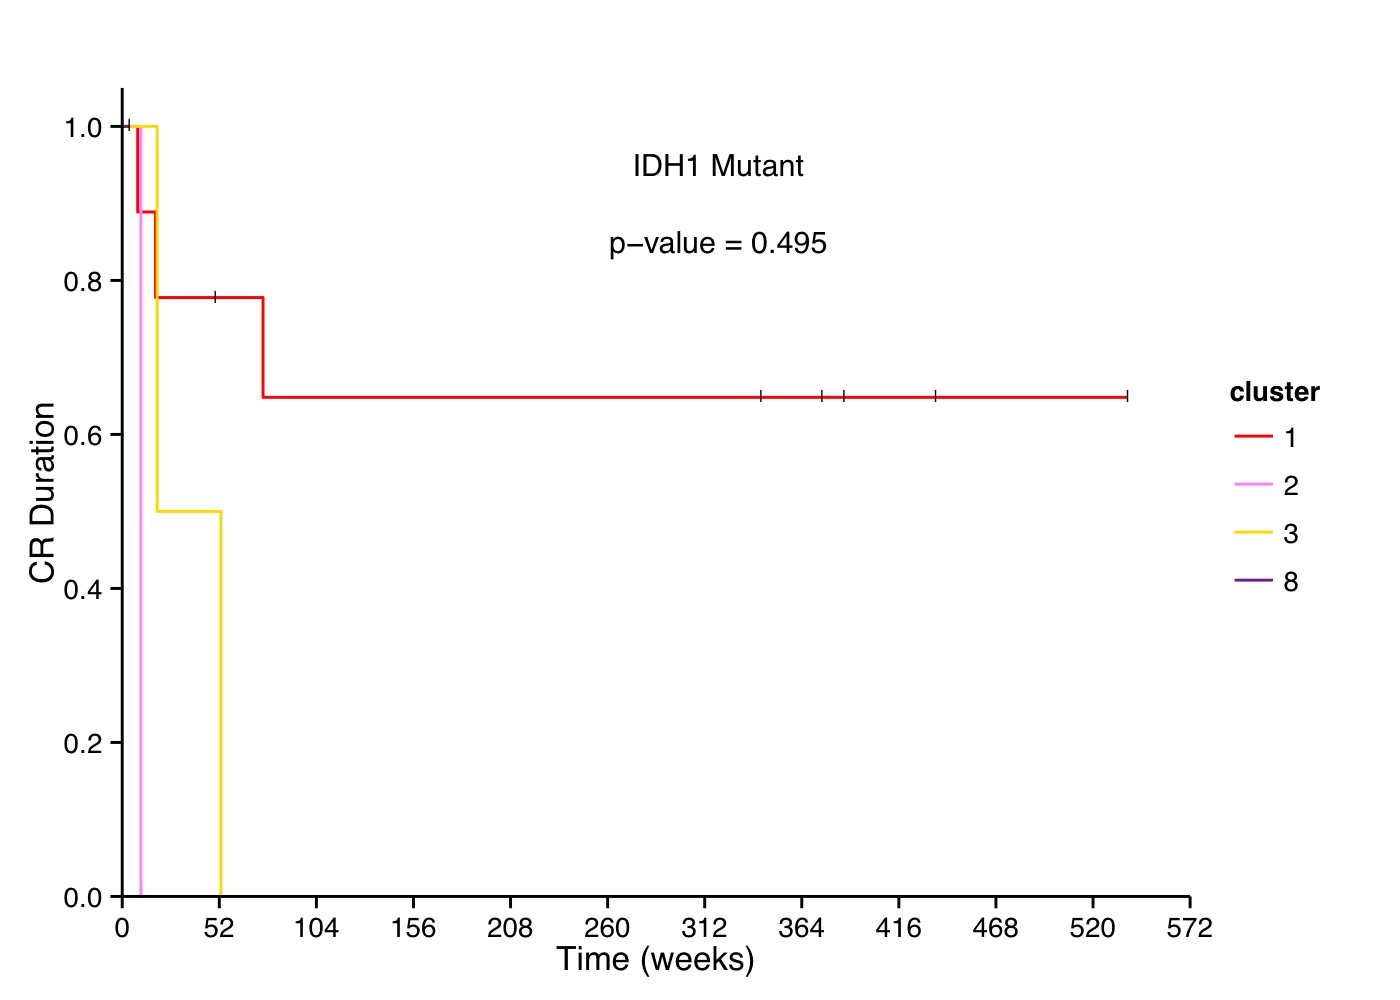
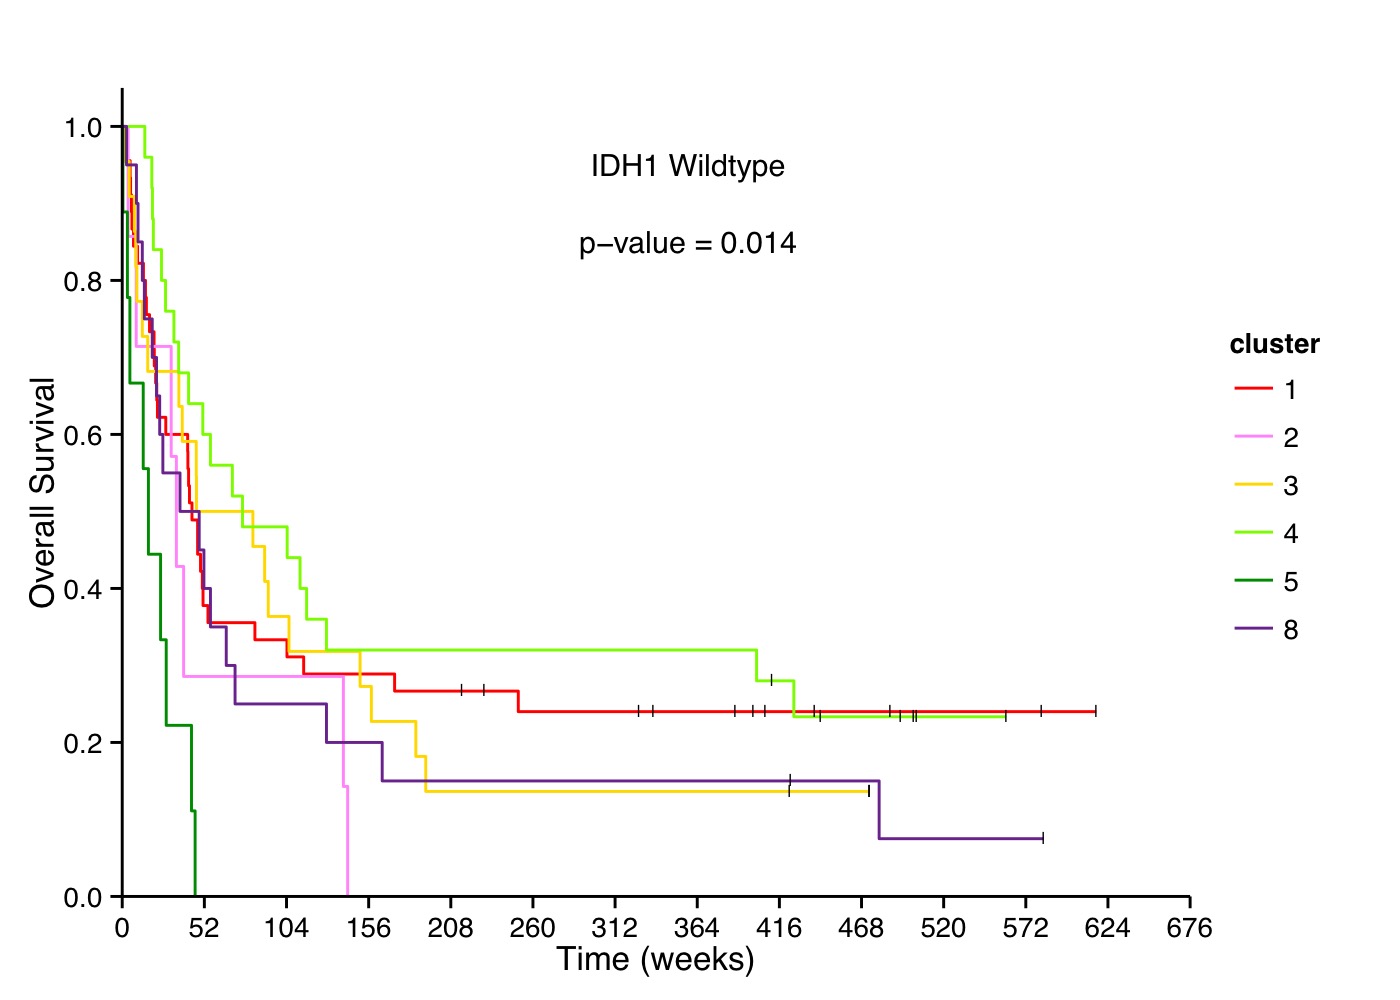
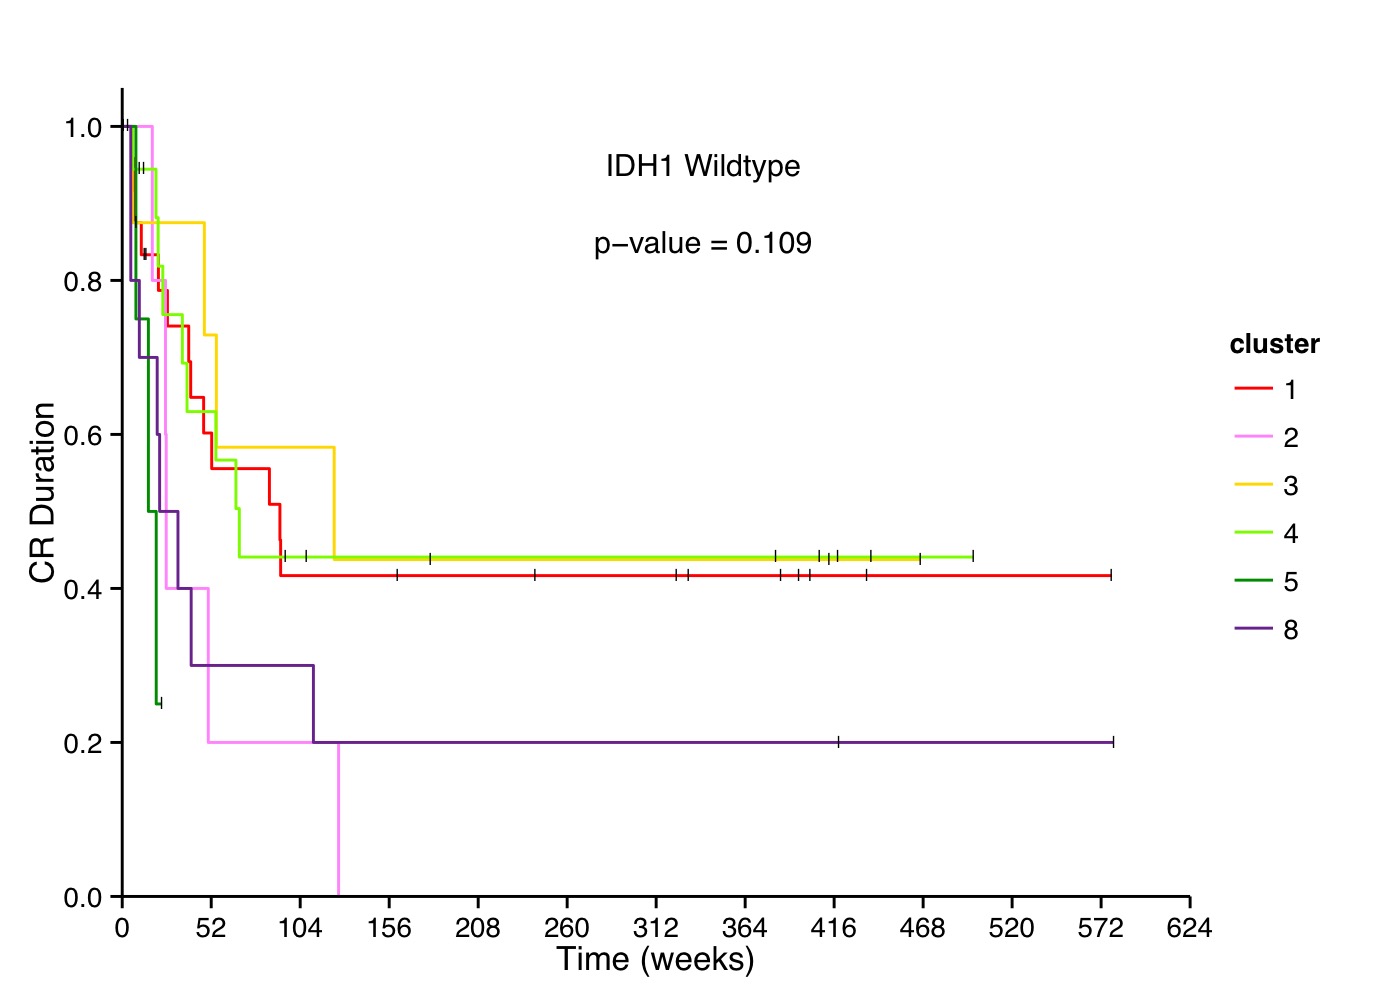
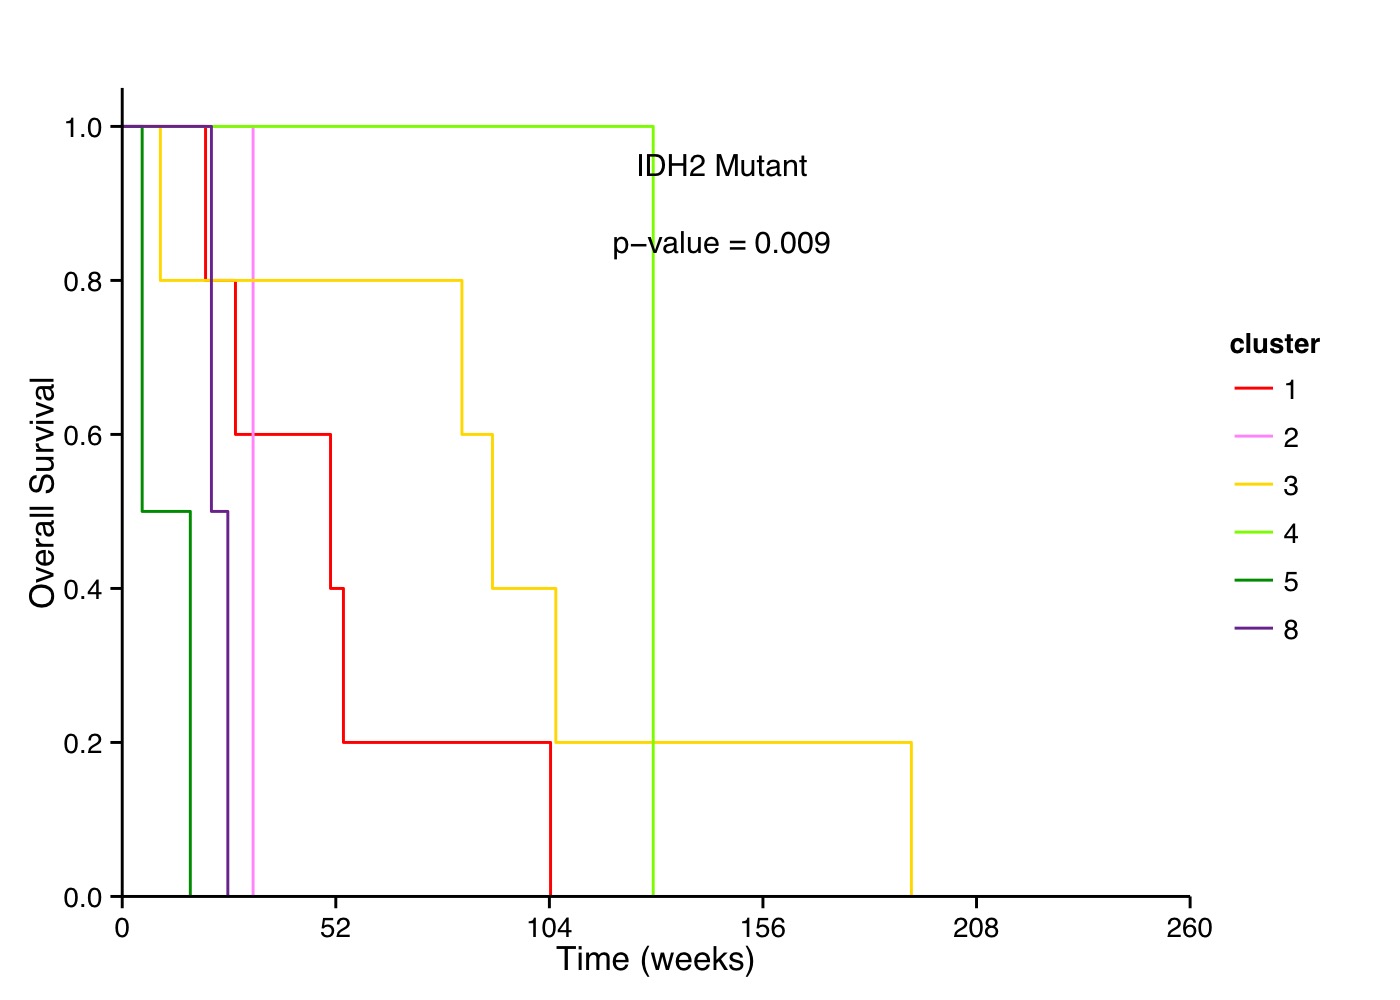
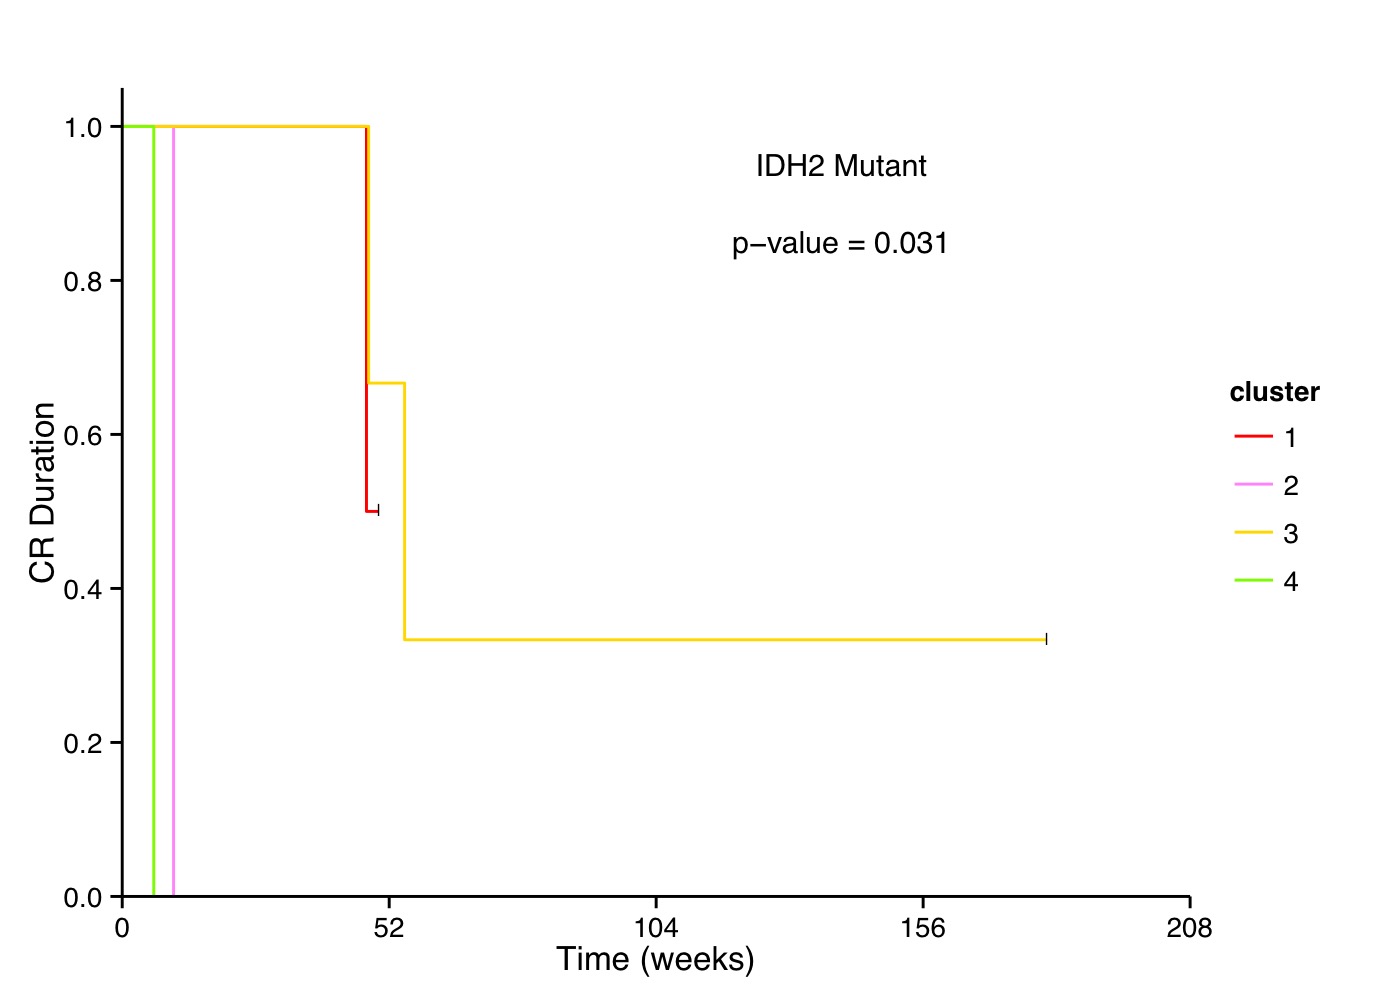
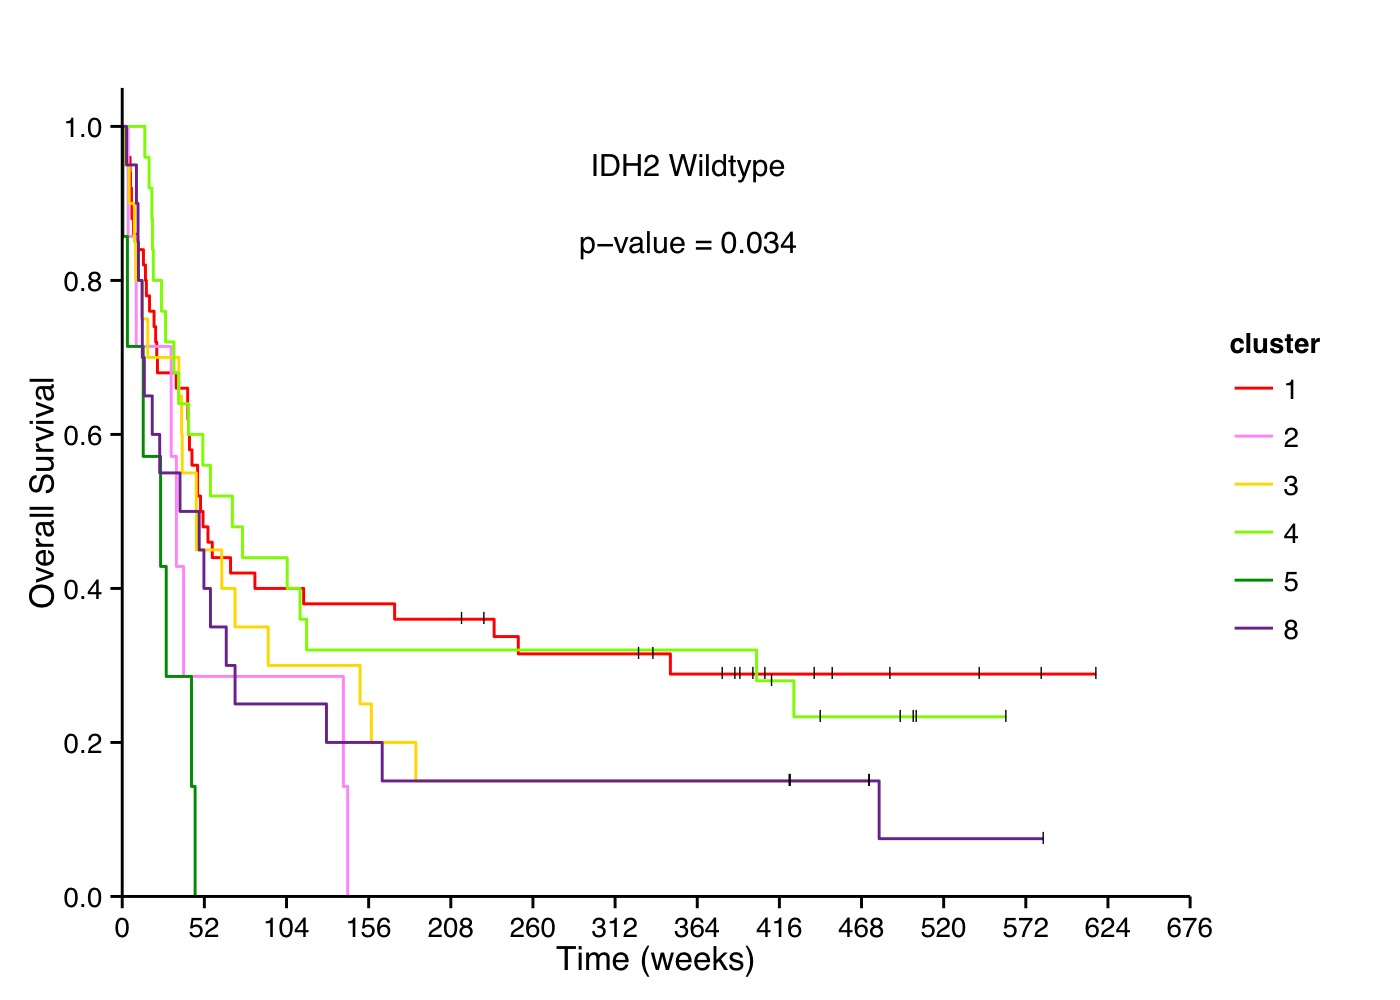
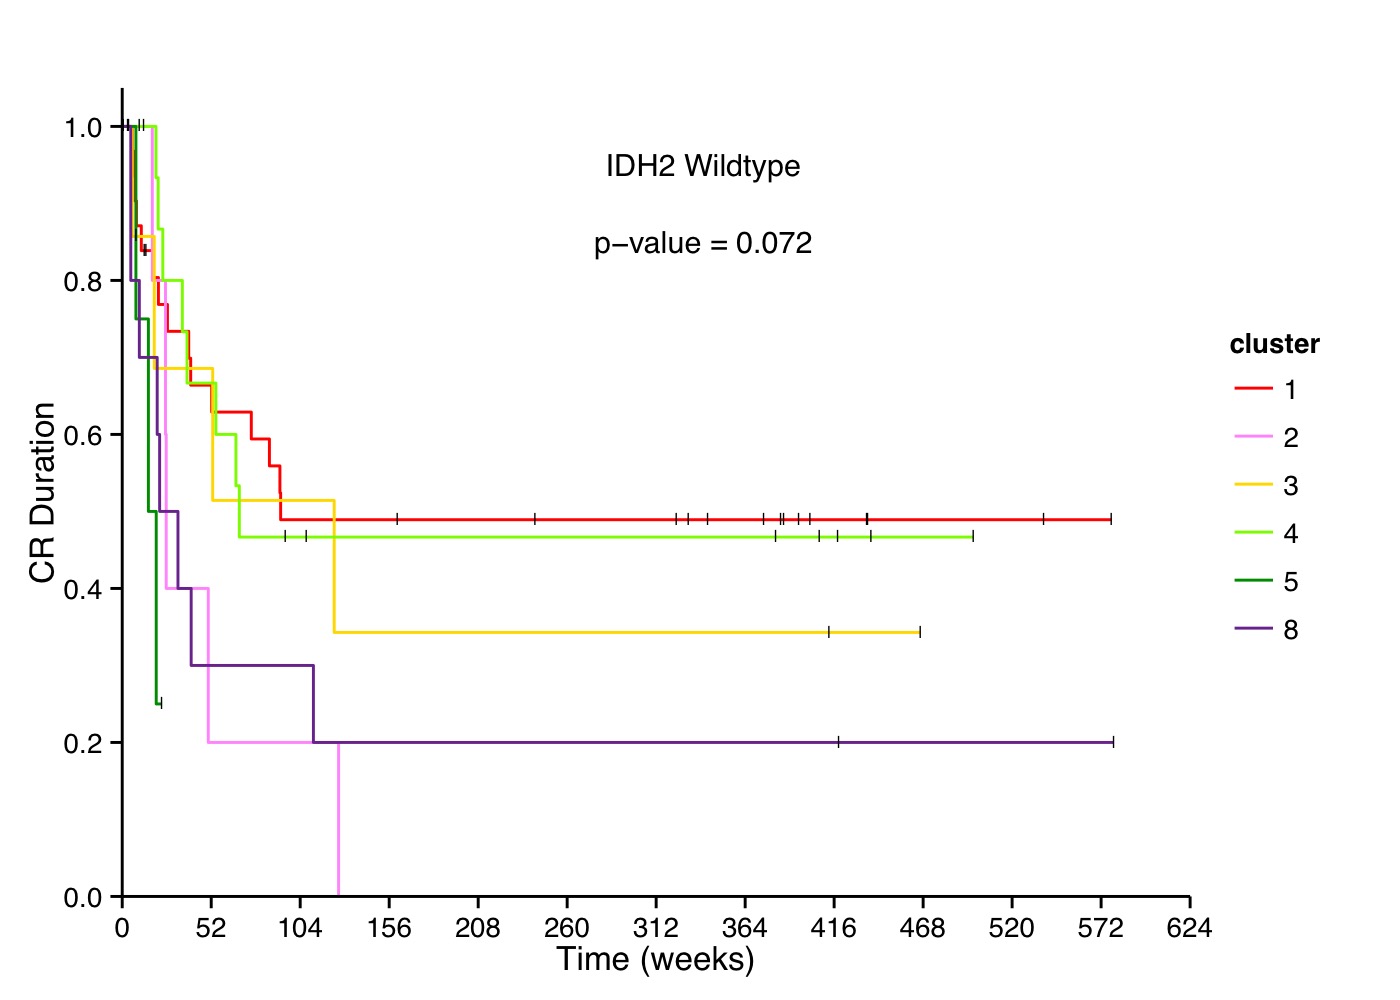
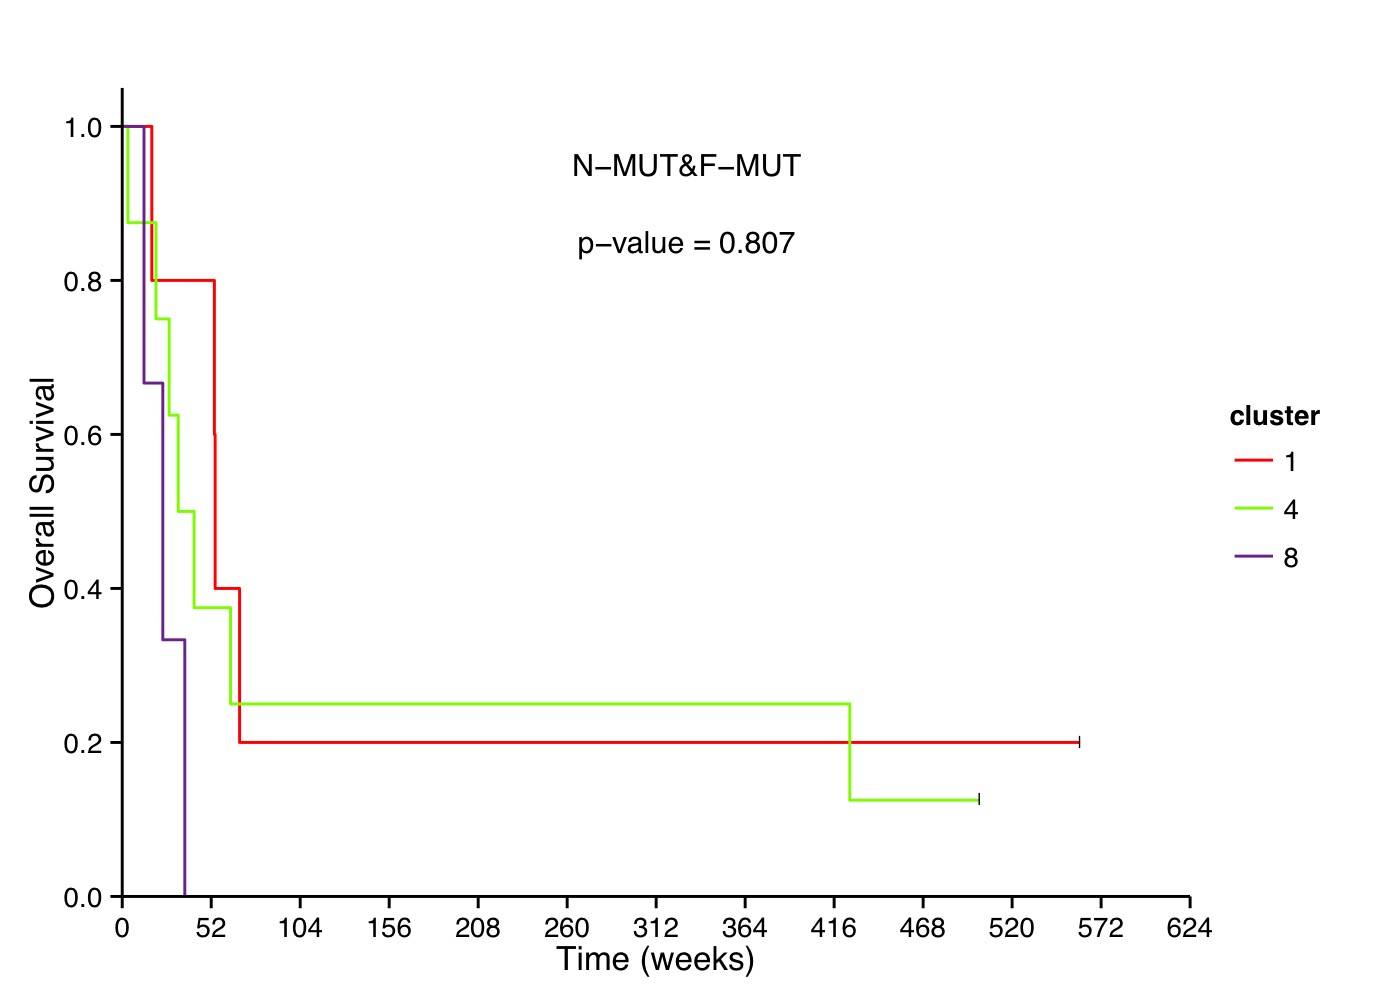
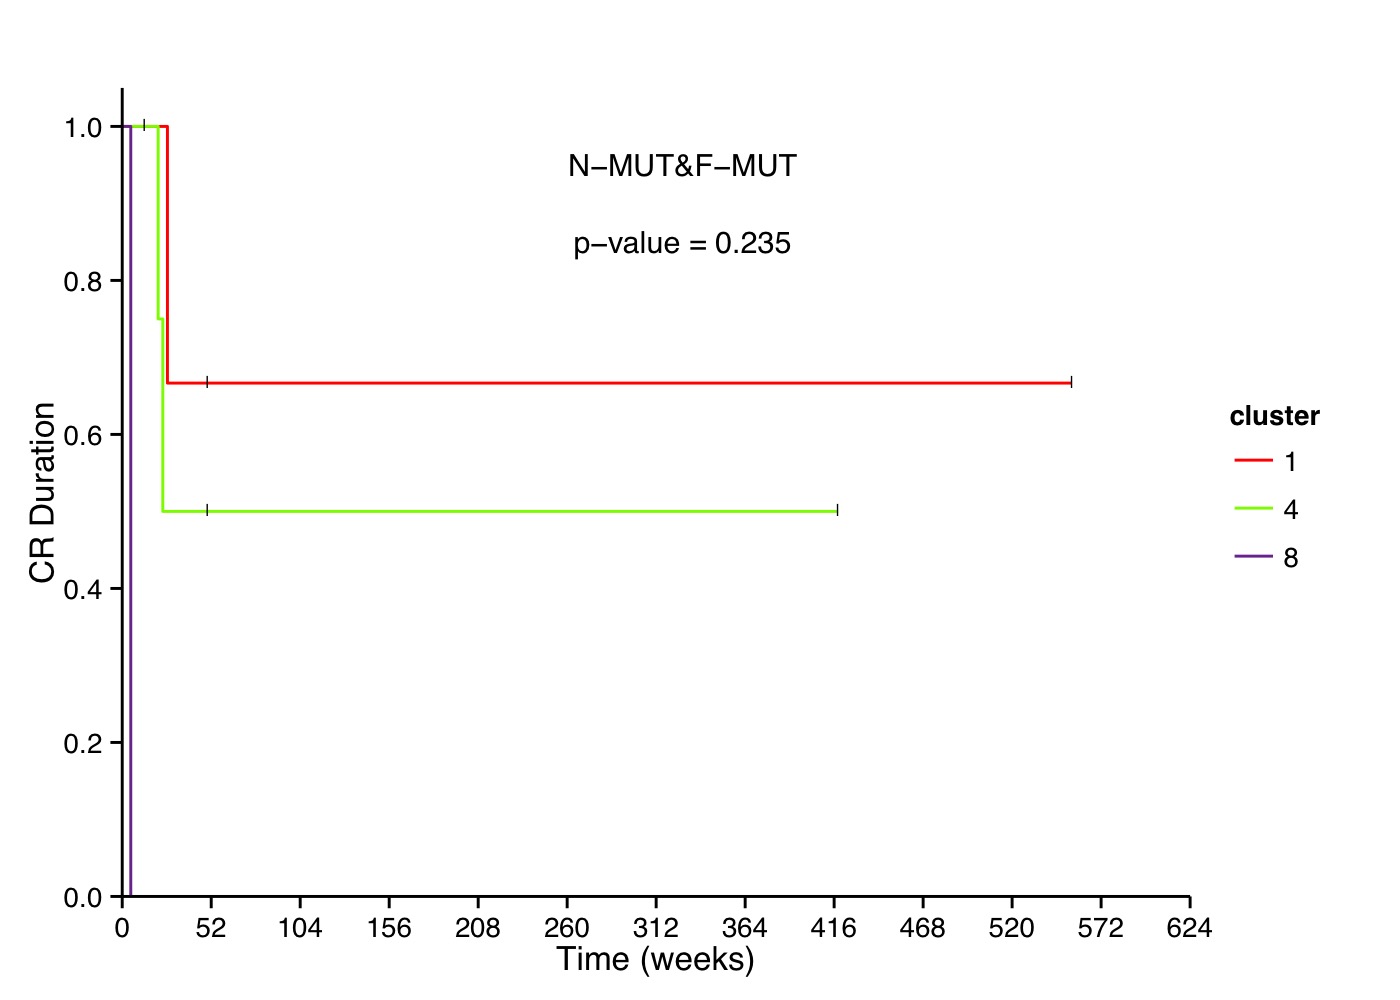
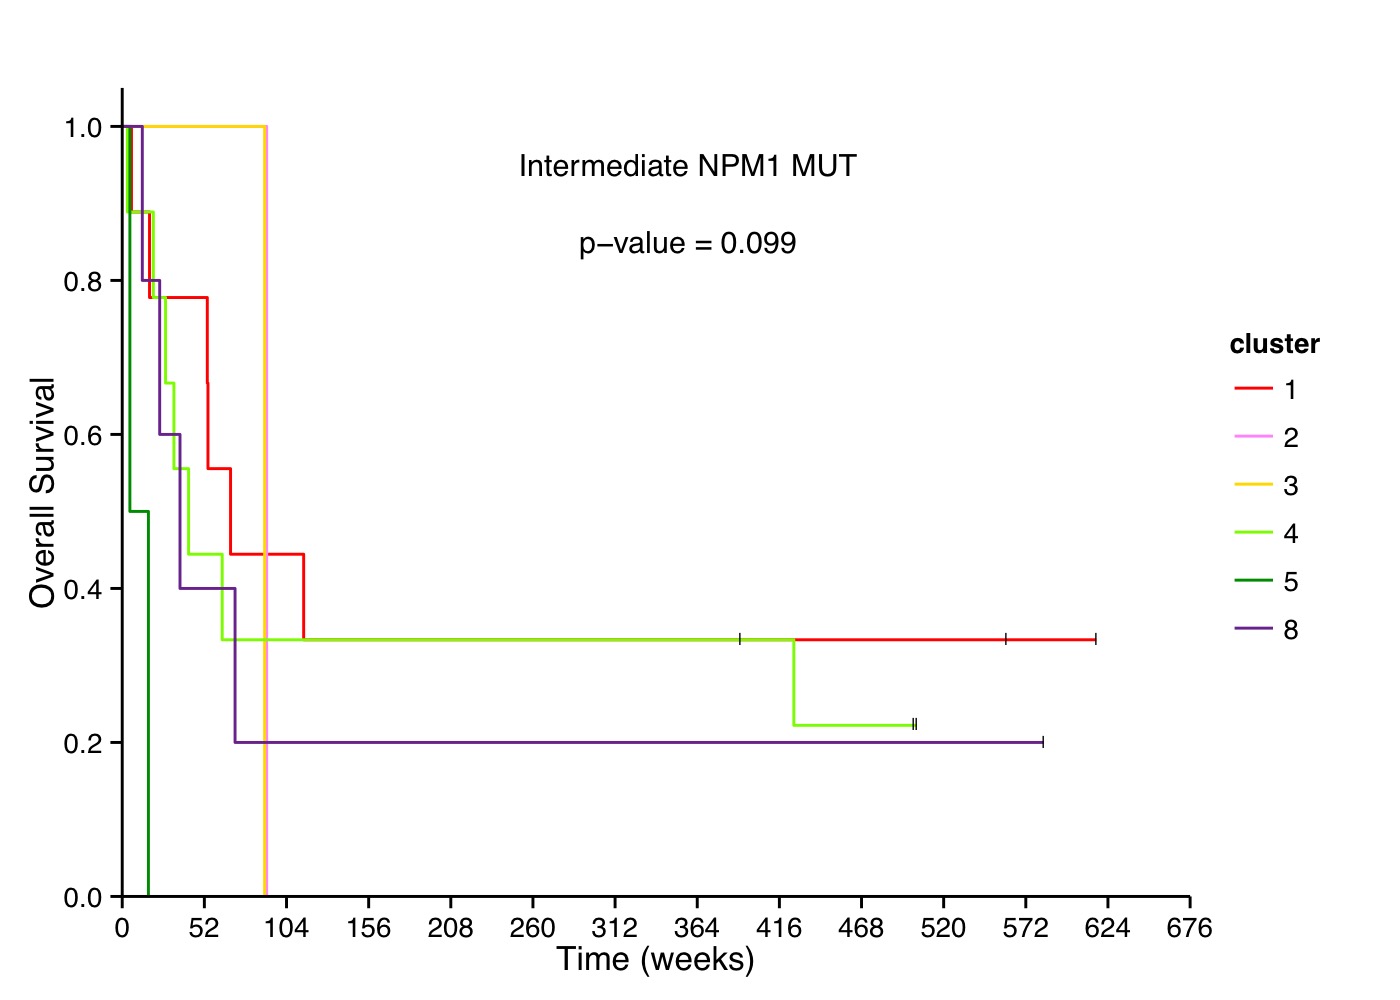
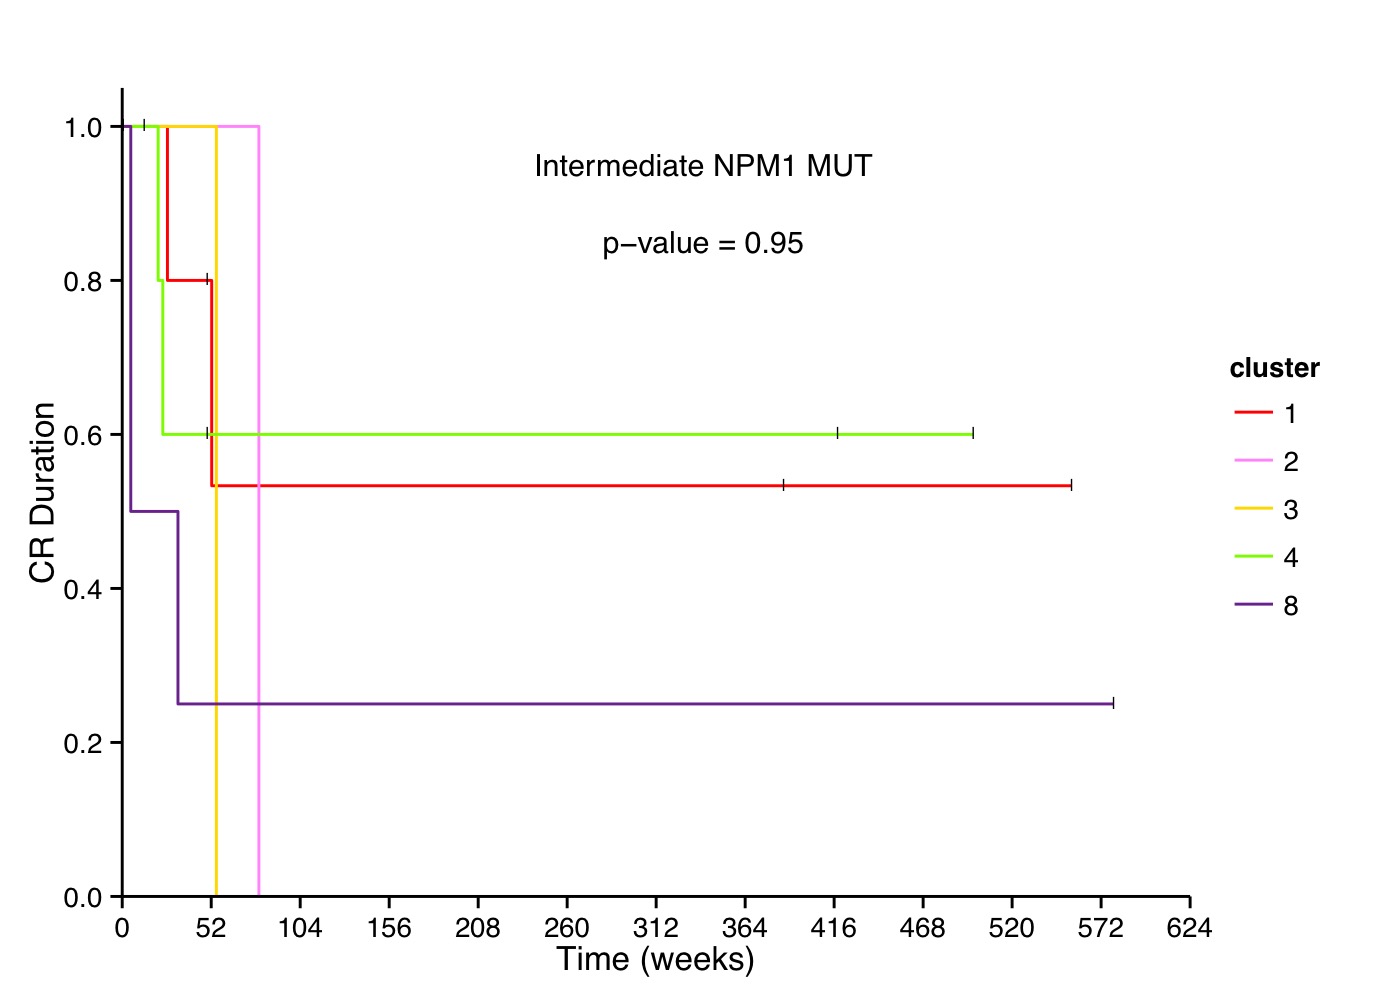
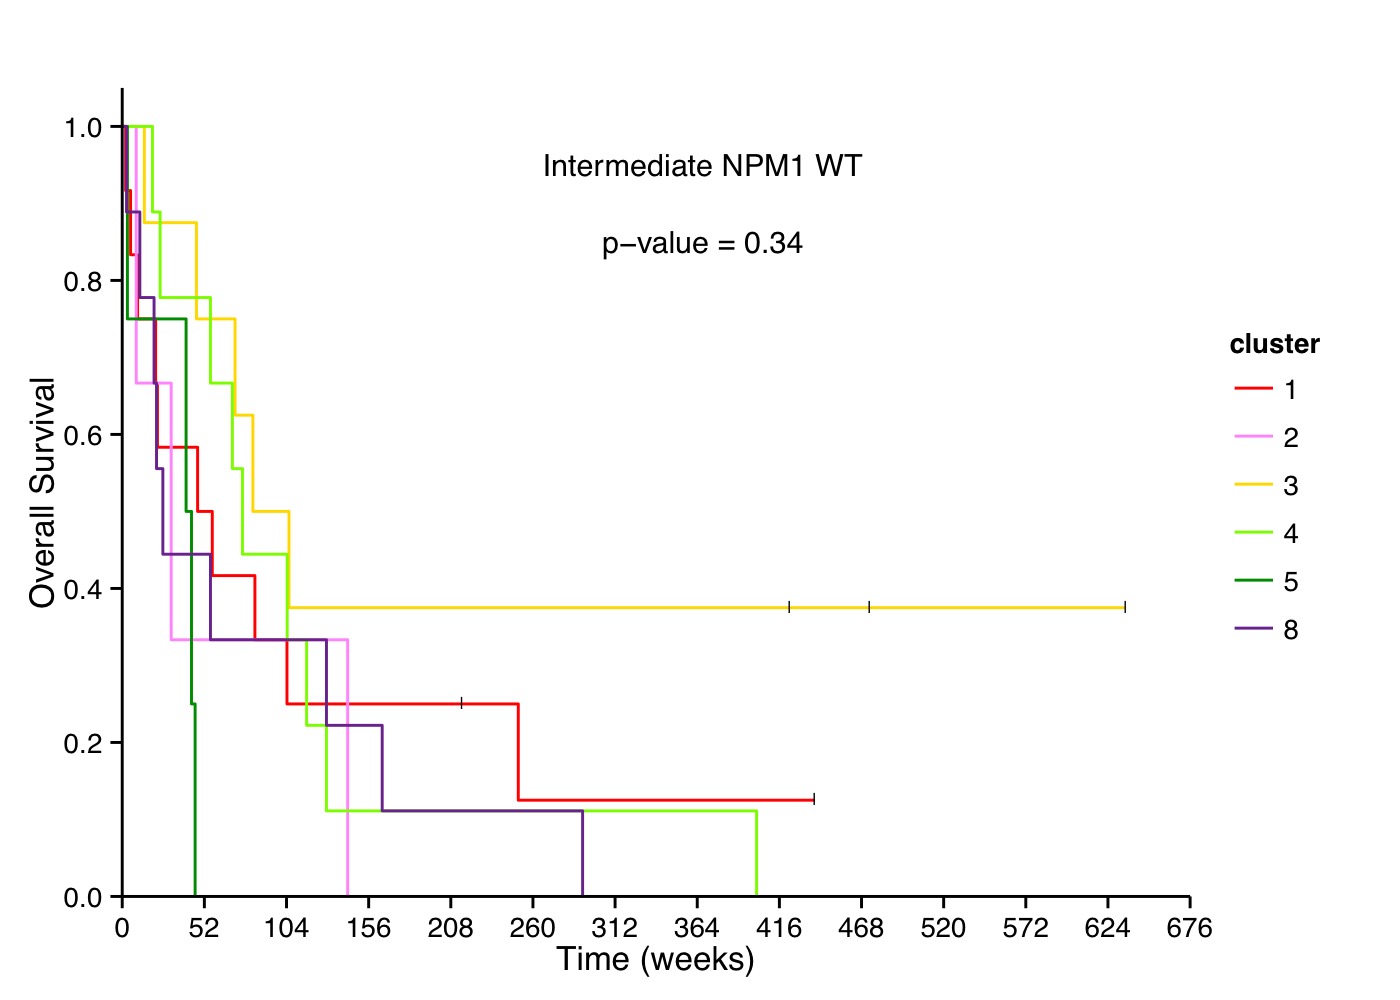
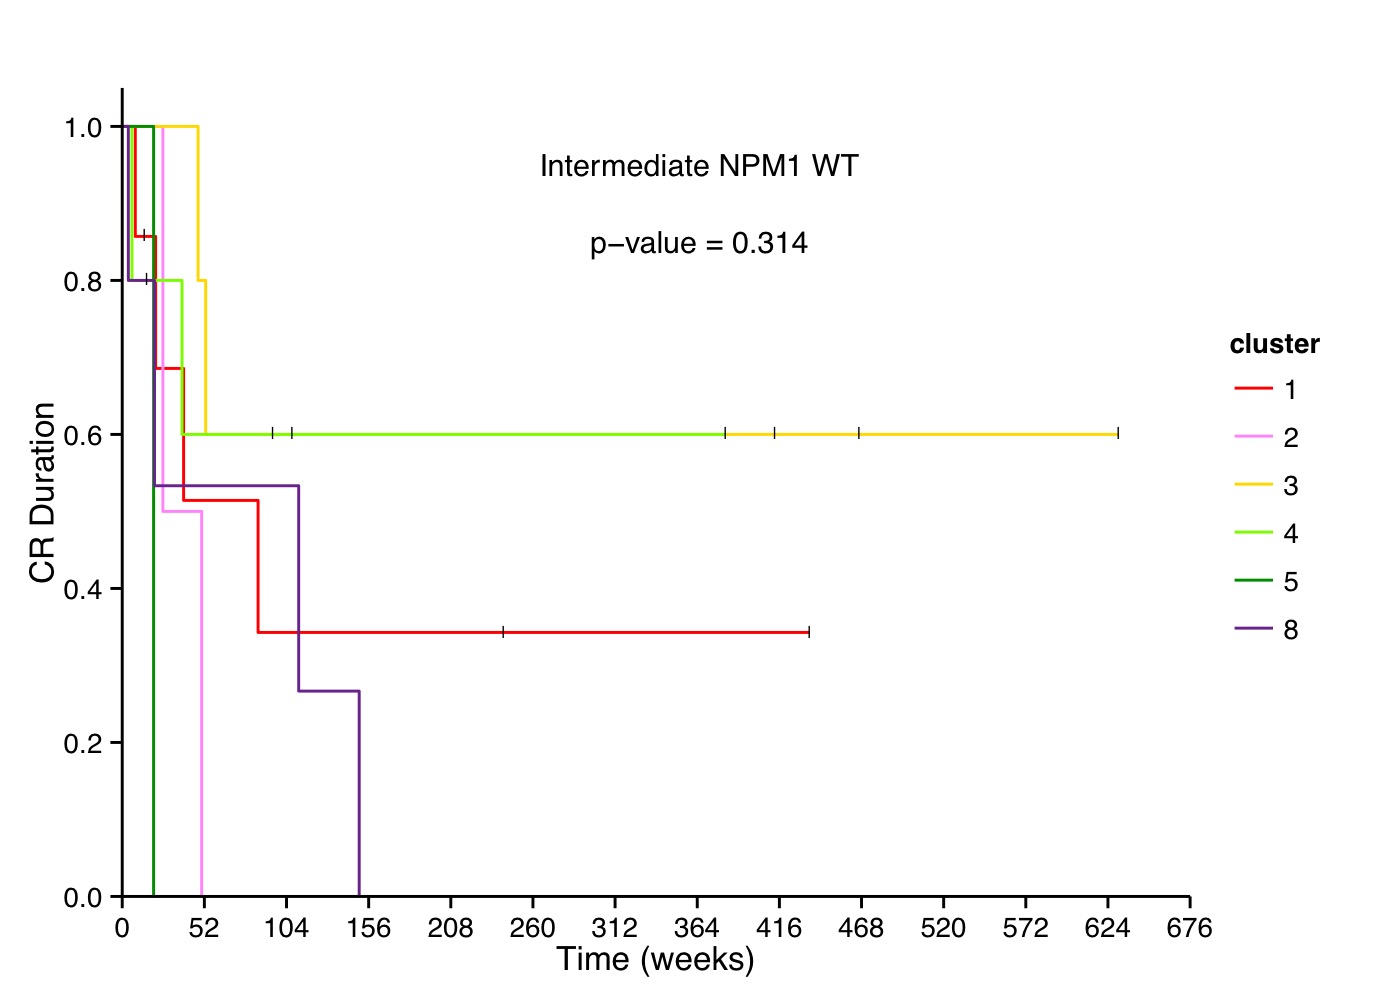
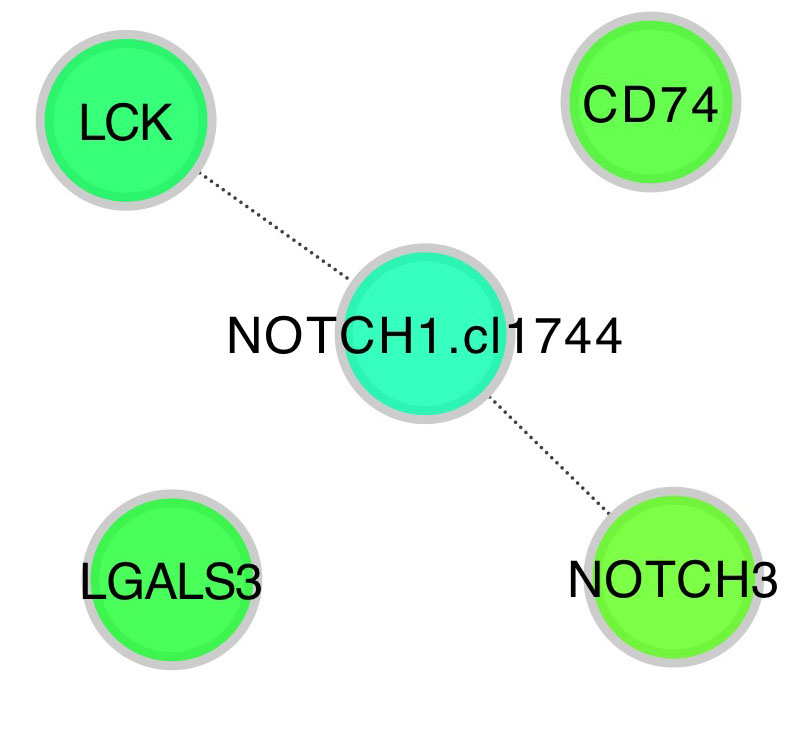
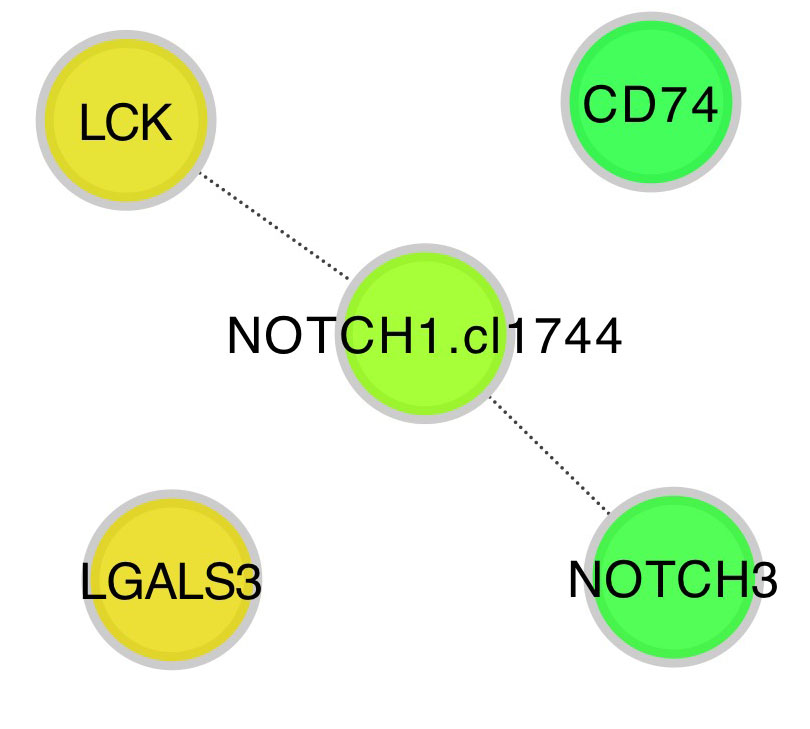
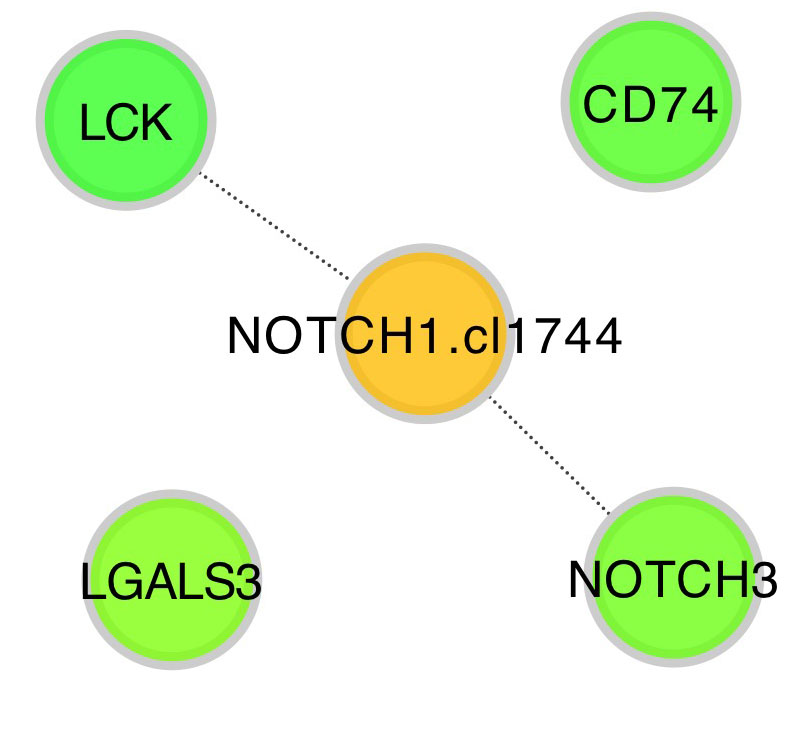
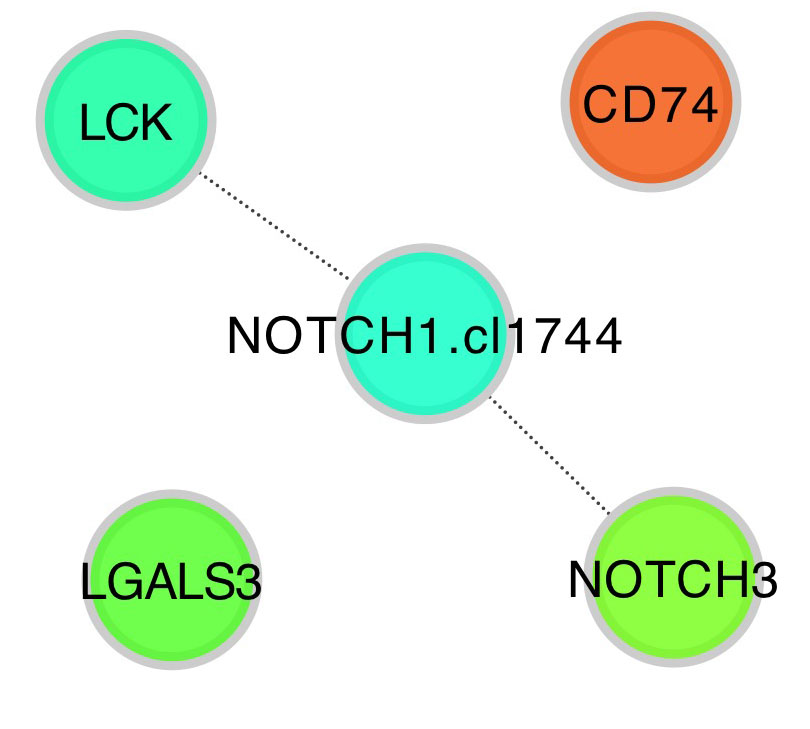
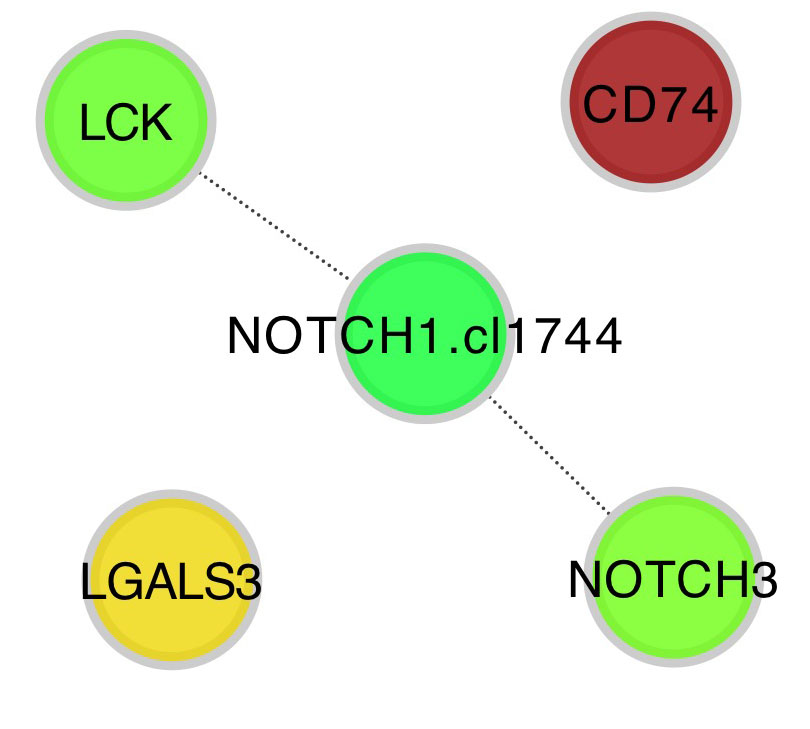
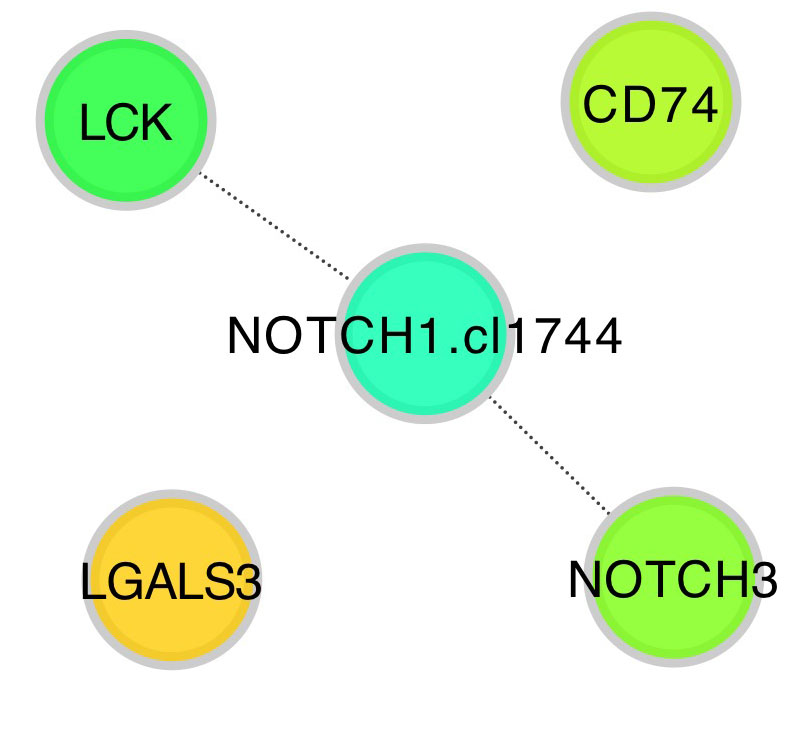
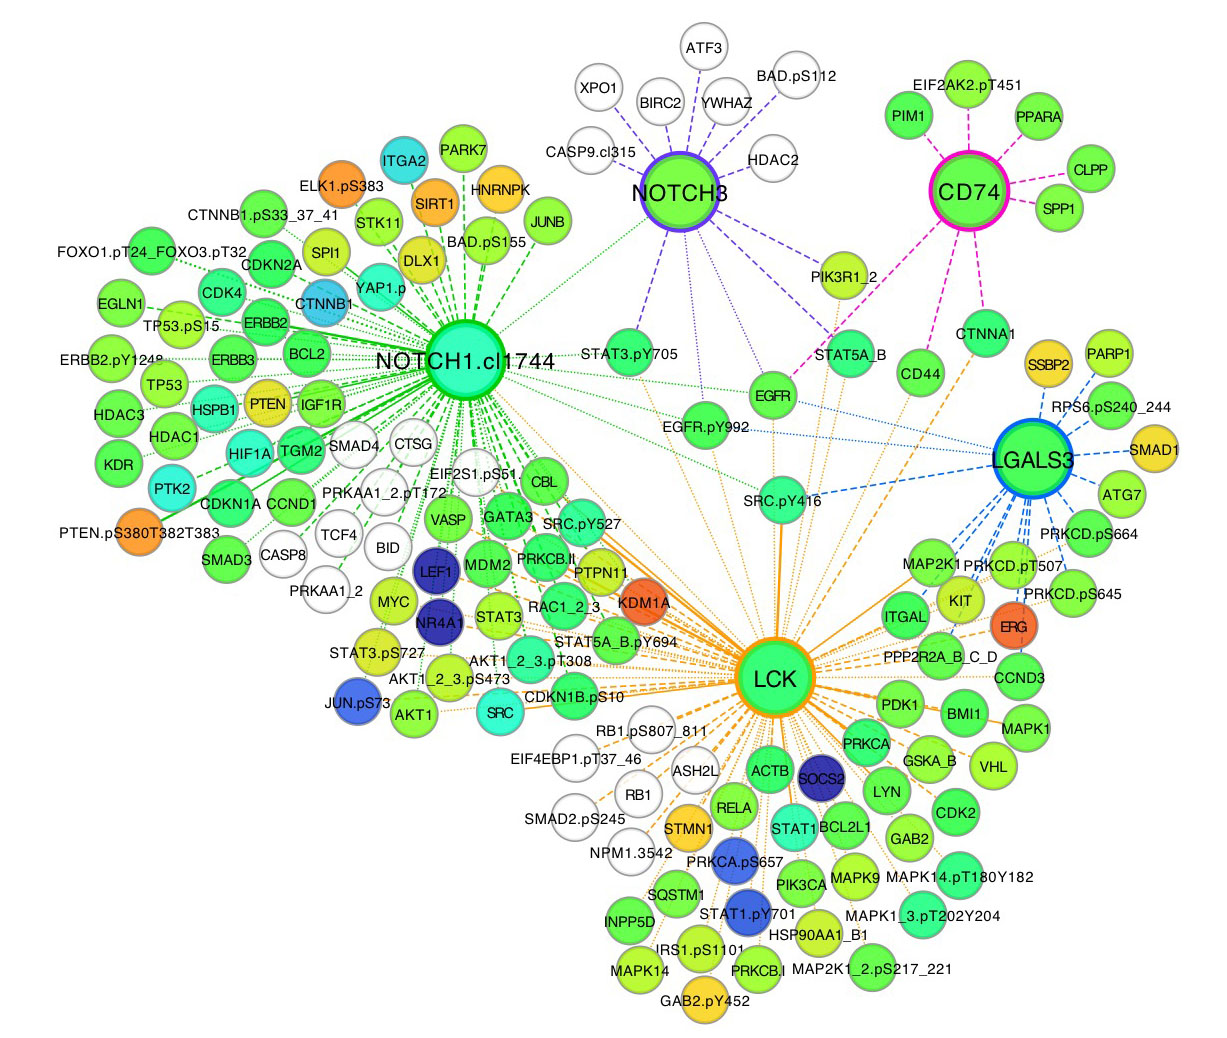
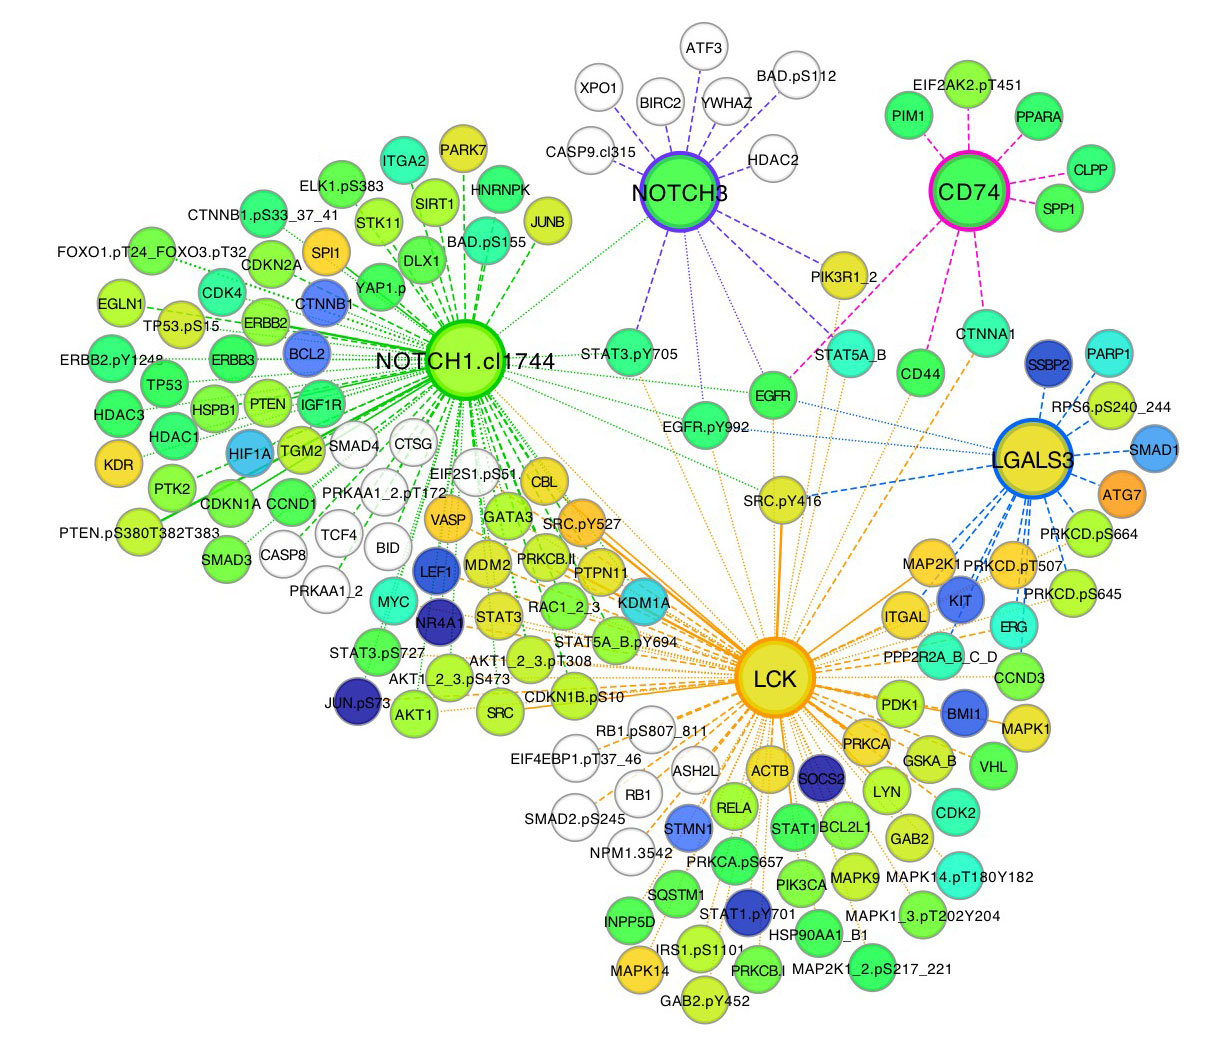
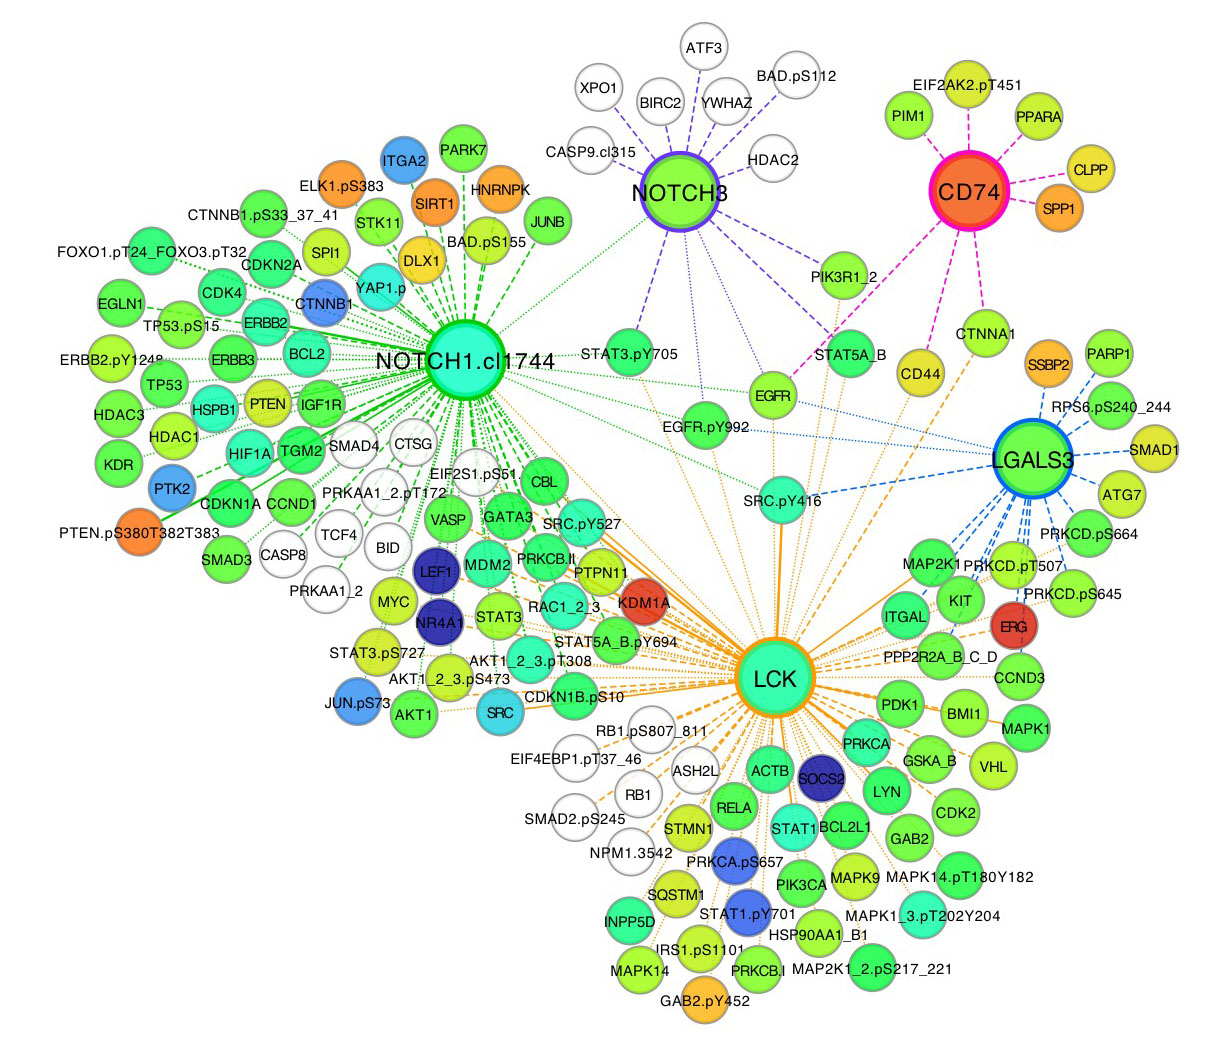
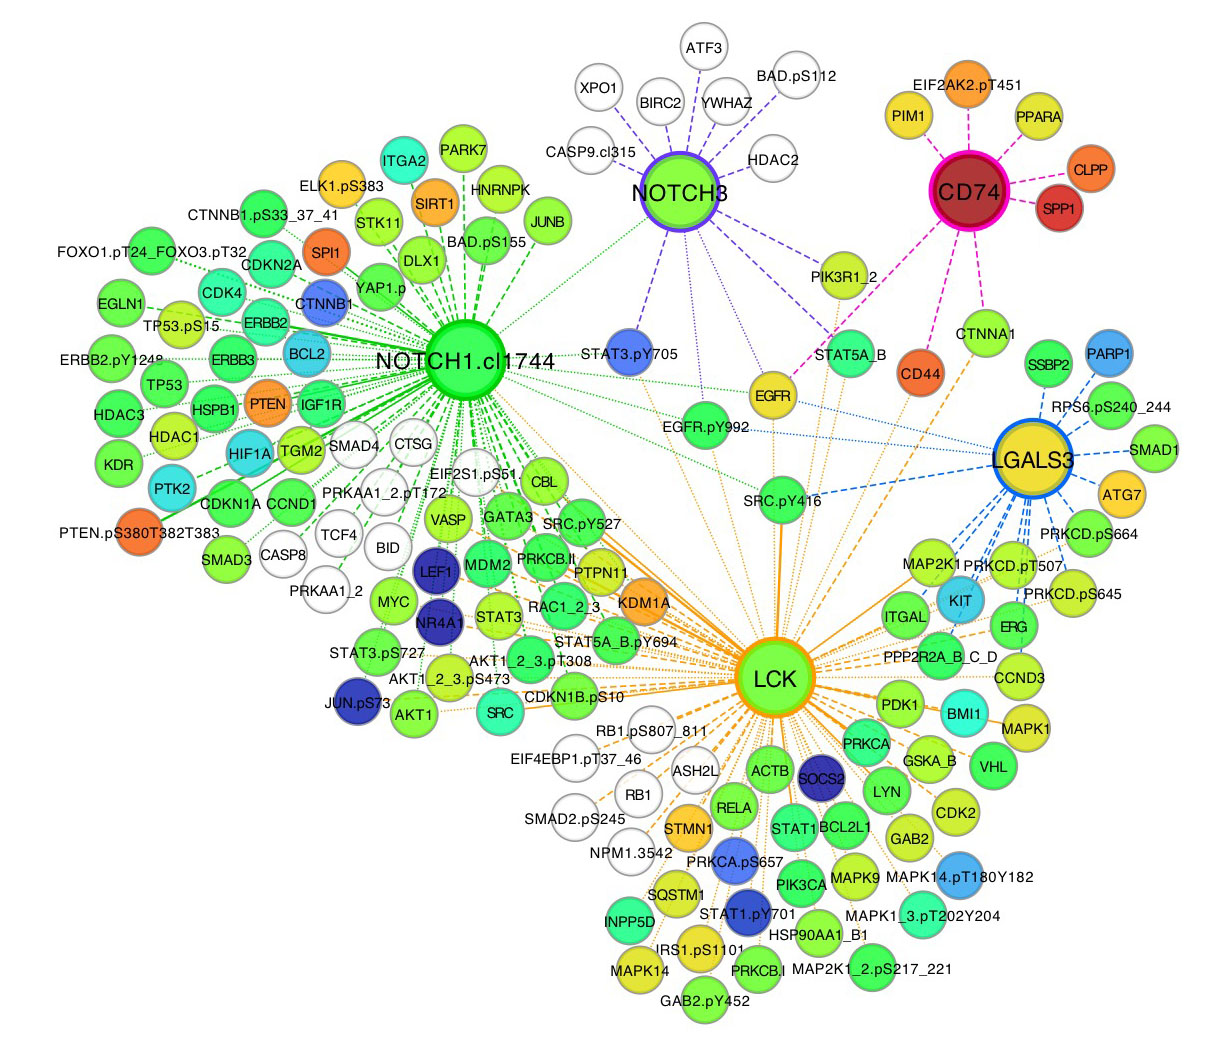
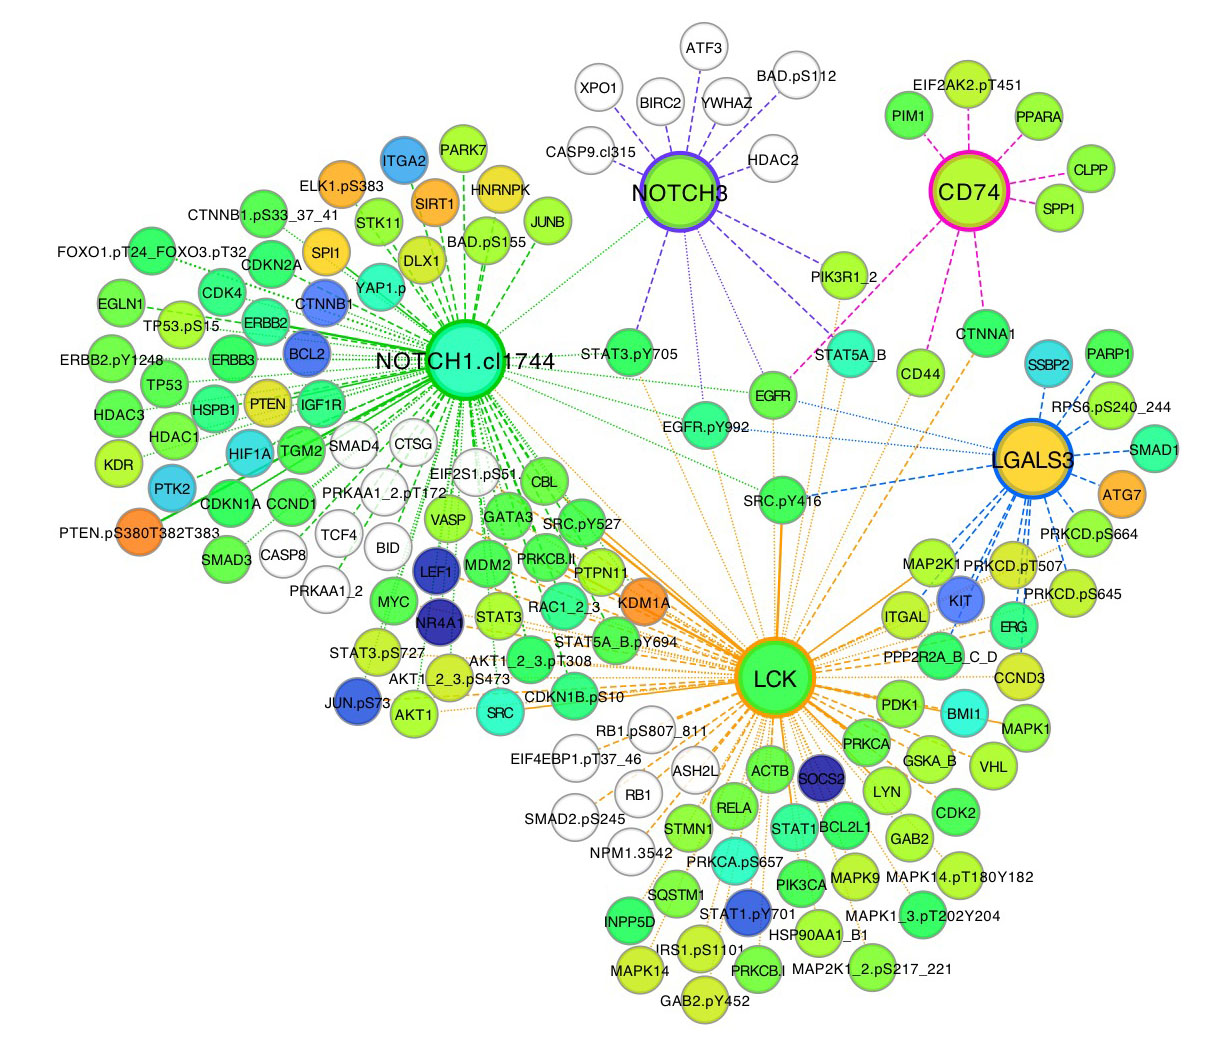
Acute myeloid leukemia patients clustered into groups by their t-cell proteins and phosphoprotein levels. Heatmap shows data from fresh bone marrow and peripheral blood samples.

Outcome Curves

Overall Survival Complete Remission
All Fav. Int. Unfav.
os_fav os_unf os_tot cr_tot os_all_DNMT3Amt os_all_DNMT3Awt cr_all_DNMT3Amt cr_all_DNMT3Awt os_all_IDH1mt cr_all_IDH1mt os_all_IDH1wt cr_all_IDH1wt os_all_IDH2mt cr_all_IDH2mt os_all_IDH2wt cr_all_IDH2wt os_all_N-MUT&F-MUT cr_all_N-MUT&F-MUT os_all_N-MUT&F-WT cr_all_N-MUT&F-WT os_all_N-WT&F-MUT cr_all_N-WT&F-MUT os_all_N-WT&F-WT cr_all_N-WT&F-WT os_int cr_int os_int_DNMT3Amt cr_int_DNMT3Amt os_int_DNMT3Awt cr_int_DNMT3Awt os_int_flt3mt cr_int_flt3mt os_int_flt3wt cr_int_flt3wt os_int_IDH1mt cr_int_IDH1mt os_int_IDH1wt cr_int_IDH1wt os_int_IDH2mt cr_int_IDH2mt os_int_IDH2wt cr_int_IDH2wt os_int_npm1mt cr_int_npm1mt os_int_npm1wt cr_int_npm1wt cr_fav cr_unf

Functional Patterns

Pattern 1
Pattern 2
Pattern 3
Pattern 4
Pattern 5
Pattern 6